IndustryEditorial
Benchmarks became a marketing channel. Treat them like one
Benchmark tables were meant to be measurements. They are now launch collateral, optimised for by every lab and reported under whatever settings look best. That does not make them useless, but it changes how they should be read.

There was a period, roughly 2019 to 2023, when a new benchmark could tell you something about the state of the field. Someone would publish a hard test, models would score badly, and the gap between the score and human performance was a reasonable proxy for how far the technology had to go.
That period is over. Benchmarks are still published, still cited and still improve, but their primary function has changed. A benchmark table is now the centrepiece of a launch post, produced by a marketing team from numbers selected by a research team, under settings chosen to produce the best-looking row. It is collateral. This is not a conspiracy and it does not require anyone to act in bad faith. It is what happens when a measurement becomes a target for organisations with billions of dollars at stake.
Why it was inevitable
Three forces made it so.
Contamination is structural. Frontier models are trained on very large fractions of the public internet. Any benchmark whose questions or close paraphrases are public will leak into training data eventually, and the labs’ decontamination efforts, while real, are imperfect and unverifiable from outside. A score on a public benchmark is, in part, a measure of how much of that benchmark the model has seen.
Saturation is fast. Benchmarks that took years to approach human parity now saturate within months of release, because the labs are specifically optimising for the capabilities they test. Once a benchmark saturates, differences between models are noise, and noise is reported as leads.
Settings are a free variable. Number of attempts, sampling temperature, prompting strategy, tool access and, for reasoning models, thinking budget all move scores by several points. Every launch table picks the favourable combination for its own model. Our guide to model cards walks through the footnotes to check; our analysis of test-time compute explains why the thinking budget, in particular, can swing a result across a wide range.
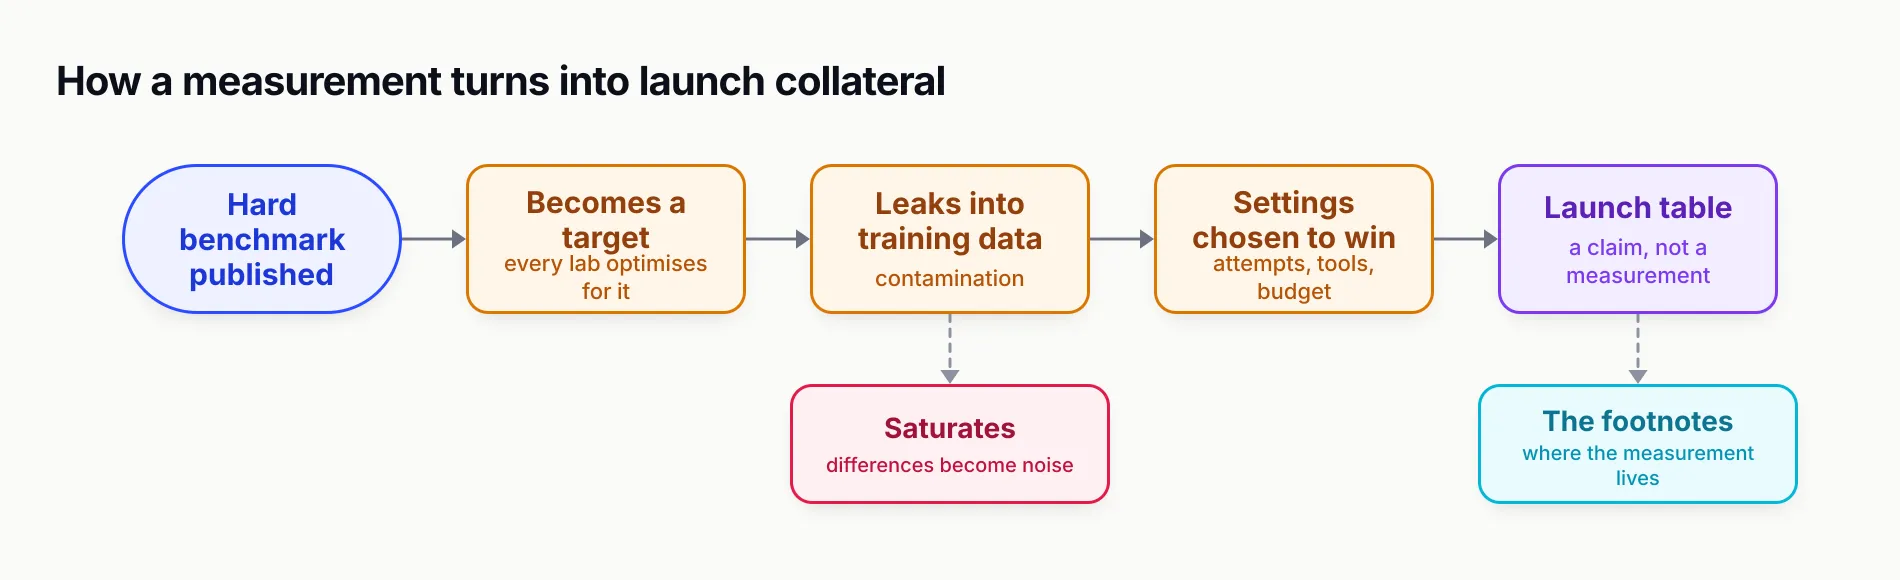
Figure 1: The lifecycle of a benchmark ends in a launch table. Nobody has to act in bad faith for this to happen.
What the tables are still good for
None of this makes benchmark tables worthless. They are good for two things.
First, ruling models out. A model that scores poorly on a relevant benchmark under generous settings is unlikely to surprise you in production. The tables are a floor, not a ceiling.
Second, tracking the field’s direction. Aggregated across many models and many months, the benchmarks describe which capabilities are improving fastest. That is useful for planning, even when individual comparisons are unreliable.
What the tables are not good for is the thing launch posts use them for: deciding that model A is better than model B for your task.
What builders should do
The answer is not to wait for a better benchmark. Any benchmark that becomes widely cited will be optimised for. The answer is evaluation that vendors cannot optimise for because they cannot see it:
- Build a private evaluation set from your own production traffic and your own definition of success. Fifty carefully labelled examples beat a thousand from a public dataset.
- Report accuracy against cost. A point estimate hides the thinking budget. A curve does not.
- Re-run it on every candidate model under the same settings. This is the only comparison that is actually fair.
- Treat vendor numbers as a screening tool, and say so internally, so nobody mistakes the brochure for the measurement.
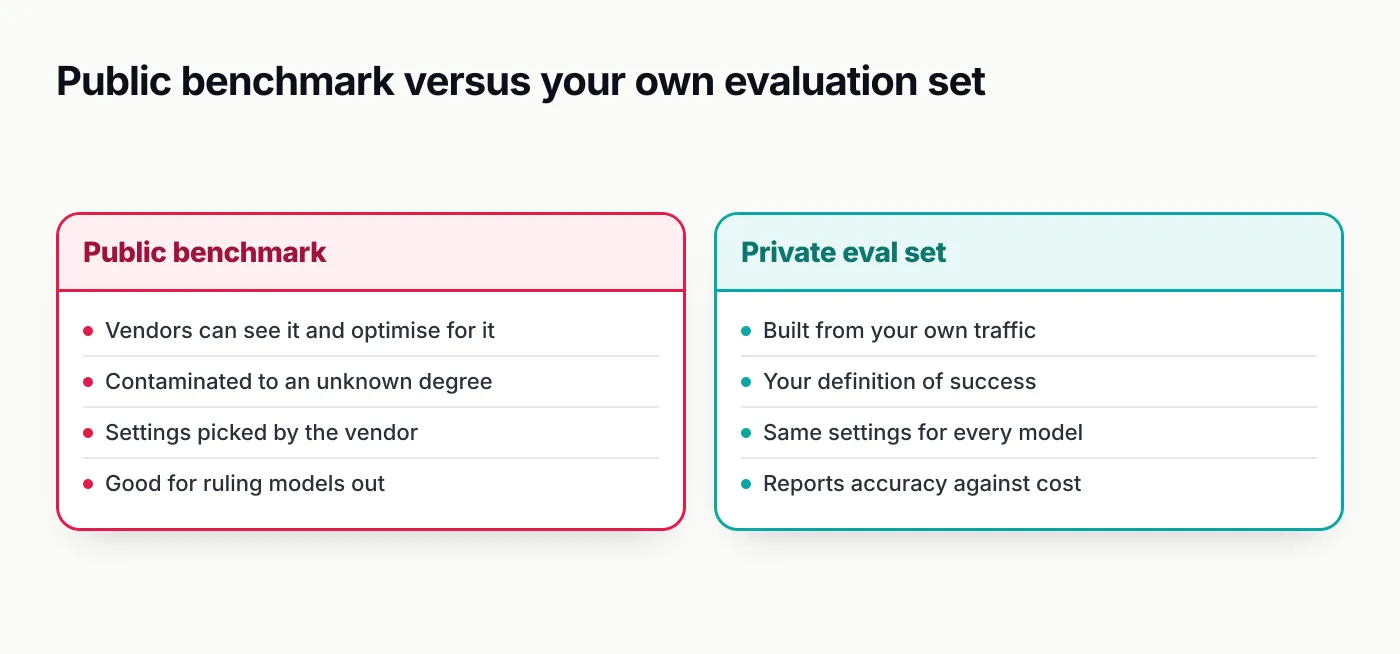
Figure 2: A private evaluation set is the only measurement a vendor cannot optimise against.
What the industry should do
Independent, cost-adjusted, contamination-resistant evaluation is a public good, and public goods are underfunded. The organisations that run held-out leaderboards, private test sets and live human-preference arenas are doing the field’s most important measurement work on a fraction of the budget of a single training run. Labs that want their benchmark claims believed should fund them, and should publish their numbers under the independent bodies’ settings rather than their own.
Until then, read the footnotes, run your own tests and remember what a launch table is for. It is for launching.