IndustryExplainer
The real cost of running an AI product, line by line
Token spend is the line everyone watches and rarely the largest. A working breakdown of where the money goes in a production generative AI product, from inference and evaluation to the humans in the loop.
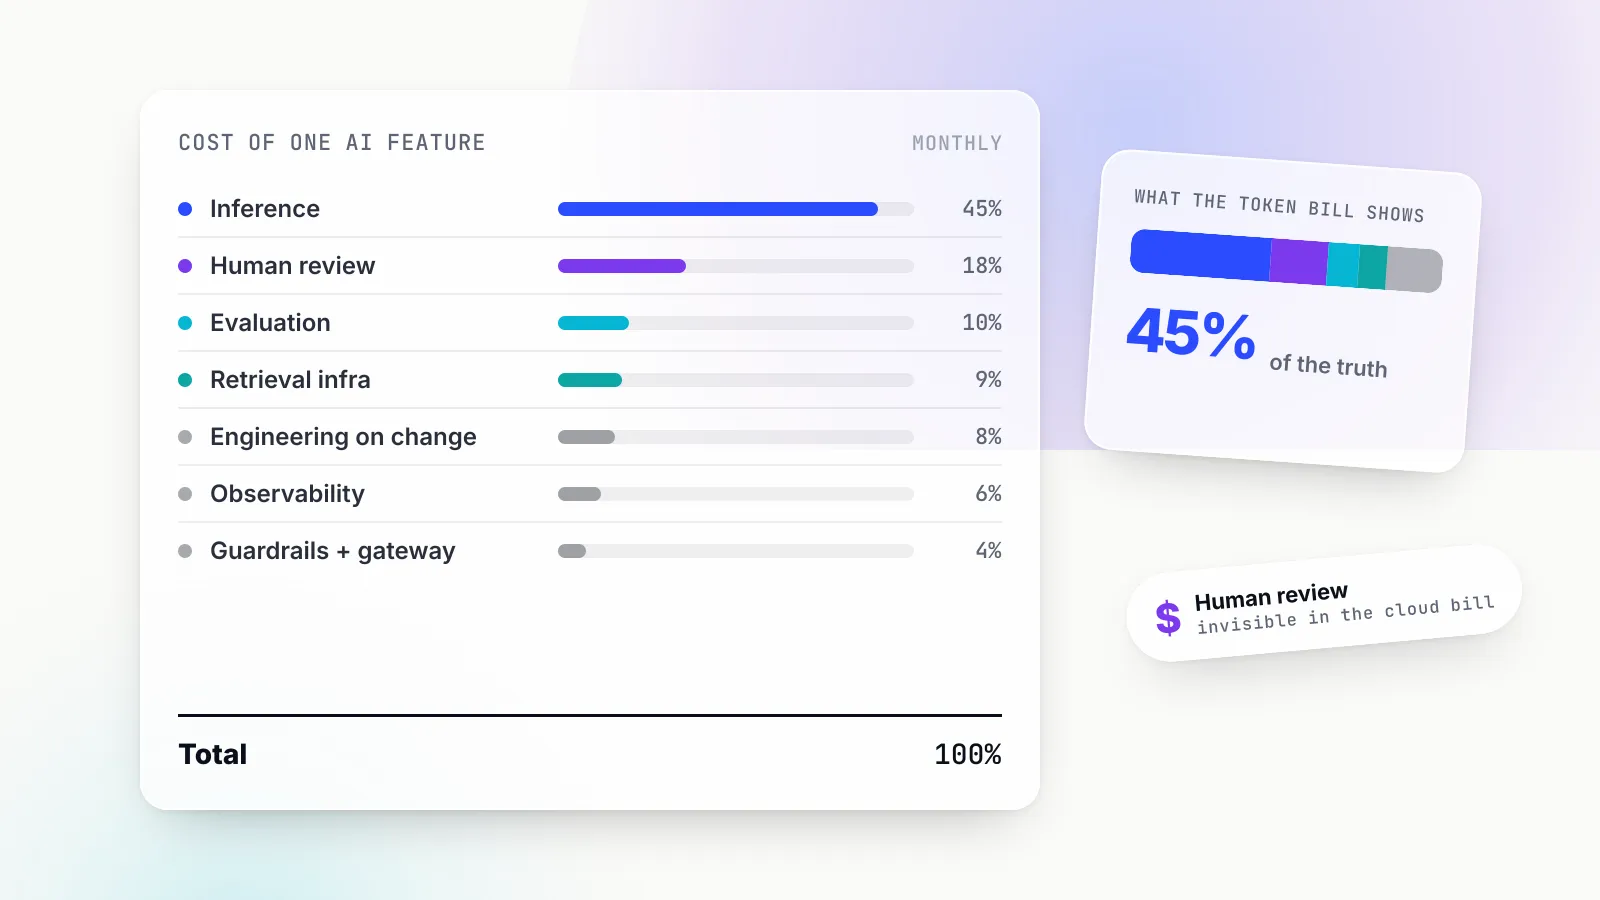
Ask a team what their AI feature costs and they will quote a token bill. It is the most visible number, it arrives monthly from the provider and it is the one the finance team asks about. It is also, in most production systems we have looked at, well under two-thirds of the true cost, and frequently under half.
This is a line-by-line breakdown of where the rest goes, with the metrics that make each line manageable.
1. Inference
The token bill: input tokens, output tokens, and increasingly separate prices for cached input, long context and reasoning tokens. It is the line that falling model prices improve, and the only one.
Manage it with: cost per completed task, not cost per token; a cache hit rate target; and a per-task token budget with a hard cap. For agentic features, track the distribution of cost per task, because the mean is set by a small number of runaway runs.
2. Retrieval and context infrastructure
Anything that assembles the prompt: vector databases, search indexes, embedding generation, document processing pipelines and the storage behind them. These scale with corpus size and query volume, and embedding costs recur every time you change the embedding model or the chunking strategy.
Manage it with: cost per query for retrieval separated from inference, and a re-indexing budget line for model changes.
3. Evaluation
Every prompt change, model swap and retrieval tweak needs to be checked against a test set before it ships. Doing that properly means labelled data, a harness, model-graded rubrics (which themselves cost tokens) and periodic human review of the grader.
Teams that skip this line pay for it in the next one instead. Our survey of agent frameworks found evaluation to be the least-solved problem in every camp, and our editorial on benchmarks as marketing explains why public numbers cannot substitute for it.
Manage it with: evaluation cost as a percentage of inference spend (a healthy figure is often 10 to 20 percent), and a fixed evaluation budget per model swap.
4. Observability and logging
Storing prompts, completions, tool calls and traces at production volume is a real storage and processing cost, and the tooling to search and analyse them is either a vendor bill or engineering time. Retention policies matter: full-fidelity traces for thirty days and sampled traces after is a common compromise.
Manage it with: sampling rates tied to feature maturity, and retention tiers.
5. Human review and escalation
Any feature with a quality bar has humans behind it: reviewers checking a sample of outputs, support staff handling escalations when the model is wrong, and domain experts labelling data for evaluation. This line is invisible in the cloud bill and often the largest single cost in regulated domains.
Manage it with: review rate as a first-class metric with a plan to reduce it as measured quality rises.
6. Engineering time on change
Models are deprecated, prices move, better options appear. Each swap costs engineering time to re-prompt, re-evaluate and re-tune, plus the evaluation spend from line 3. Teams that swap models quarterly to capture price cuts need to budget the swap itself.
Manage it with: a standing “model change” budget rather than treating each as a project.
7. Guardrails, gateways and safety
Content filters, PII redaction, prompt-injection checks and the gateway that routes and logs everything. Often a per-request cost on top of inference, and often an extra model call.
Manage it with: per-request overhead tracked separately from inference so its cost is visible.
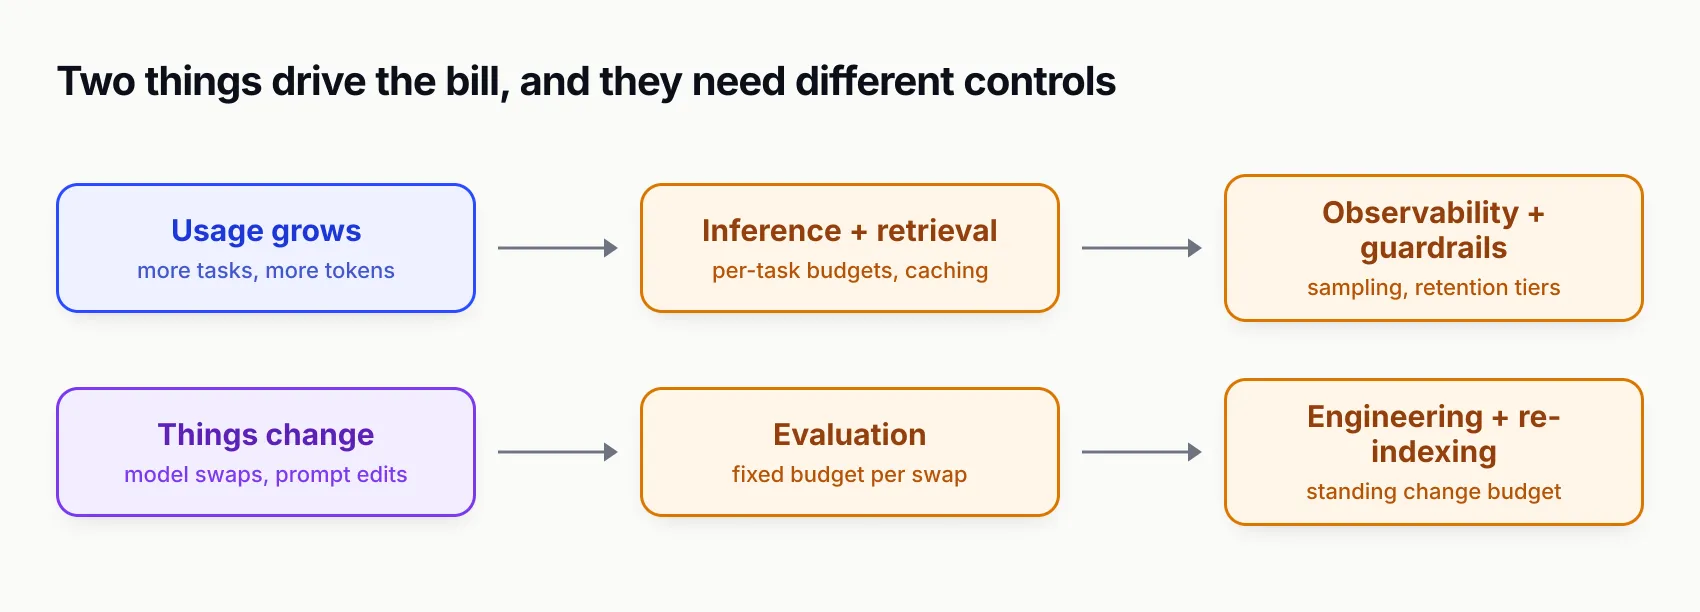
Figure 1: Costs that scale with usage and costs that scale with change need different controls.
Putting it together
A representative breakdown for a mid-scale production feature, from our conversations with teams, looks roughly like this:
| Line | Share of total | Scales with |
|---|---|---|
| Inference | 30–60% | Usage |
| Retrieval infrastructure | 5–15% | Corpus and usage |
| Evaluation | 5–15% | Rate of change |
| Observability | 5–10% | Usage |
| Human review | 5–30% | Quality gap |
| Engineering on change | 5–15% | Rate of change |
| Guardrails and gateway | 2–8% | Usage |
The ranges are wide because the mix varies enormously by product. The point is not the numbers; it is that a cost model with one line cannot tell you which optimisation to make. Build all seven, and the answer to “why did the bill go up” becomes a lookup rather than an investigation.