ToolsExplainer
Throughput vs latency: why LiteLLM Rust and Bifrost tie at 2,722 vs 2,719 RPS
Throughput vs latency for LLM gateways: why 2,722 vs 2,719 requests per second is a tie, how RPS and p99 interact, and how to read a throughput tile.
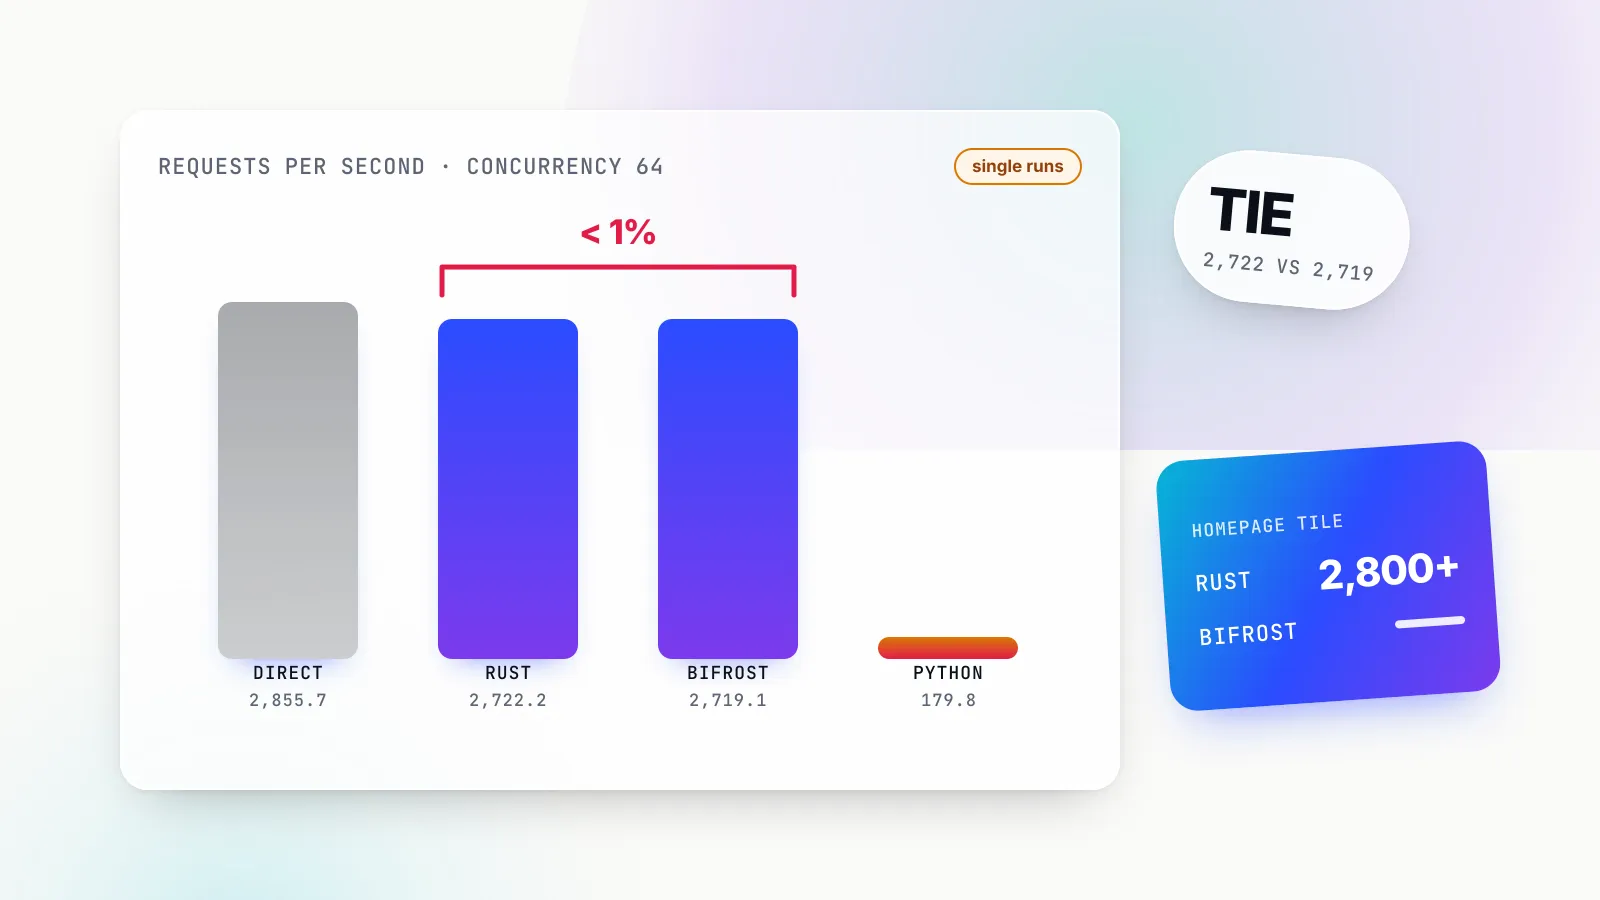
Throughput vs latency is the first distinction to settle when reading any gateway benchmark: throughput counts how many requests a system completes each second, and latency measures how long each request takes. In the concurrency sweep LiteLLM published for its new Rust gateway, the throughput question has a plain answer. At 64 concurrent requests the Rust gateway completed 2,722.2 requests per second and Bifrost 2,719.1, against 2,855.7 for a direct call and 179.8 for the LiteLLM Python proxy.
Source context: This analysis draws on LiteLLM’s published benchmark files and Maxim AI’s response. Maxim develops Bifrost, the competing gateway discussed here. No new performance tests were run for this article.
Correction, 5 November 2026: An earlier version omitted the throughput-ceiling file, overstated the consistency of Rust’s memory advantage, and, where discussed, incorrectly treated the approximately 21% CPU figure as unsupported. The ceiling file shows lower peak RSS for Bifrost and supports Rust’s rounded CPU figure.
Those are similar observed results. Every gap between the two compiled gateways in the sweep is under 1%, and each cell appears to be a single run with no confidence intervals. The reported throughput is similar for the Rust beta and Bifrost; these single runs do not establish a consistent performance winner. The same sweep also shows why throughput vs latency is the comparison that matters: at the load where throughput ties, the two gateways’ added p99 latency diverges, at +40.28 ms for Rust and +28.68 ms for Bifrost.
This explainer is for engineers who run or choose an AI gateway and want to read throughput figures the way an operator would. It covers what requests per second measures, why single-run gaps under 1% cannot establish a ranking, how throughput and tail behaviour interact under load, and how to read a throughput tile on a vendor page. Figures are as of November 1, 2026, taken from LiteLLM’s published benchmark files.
Cross-check of the published resource files
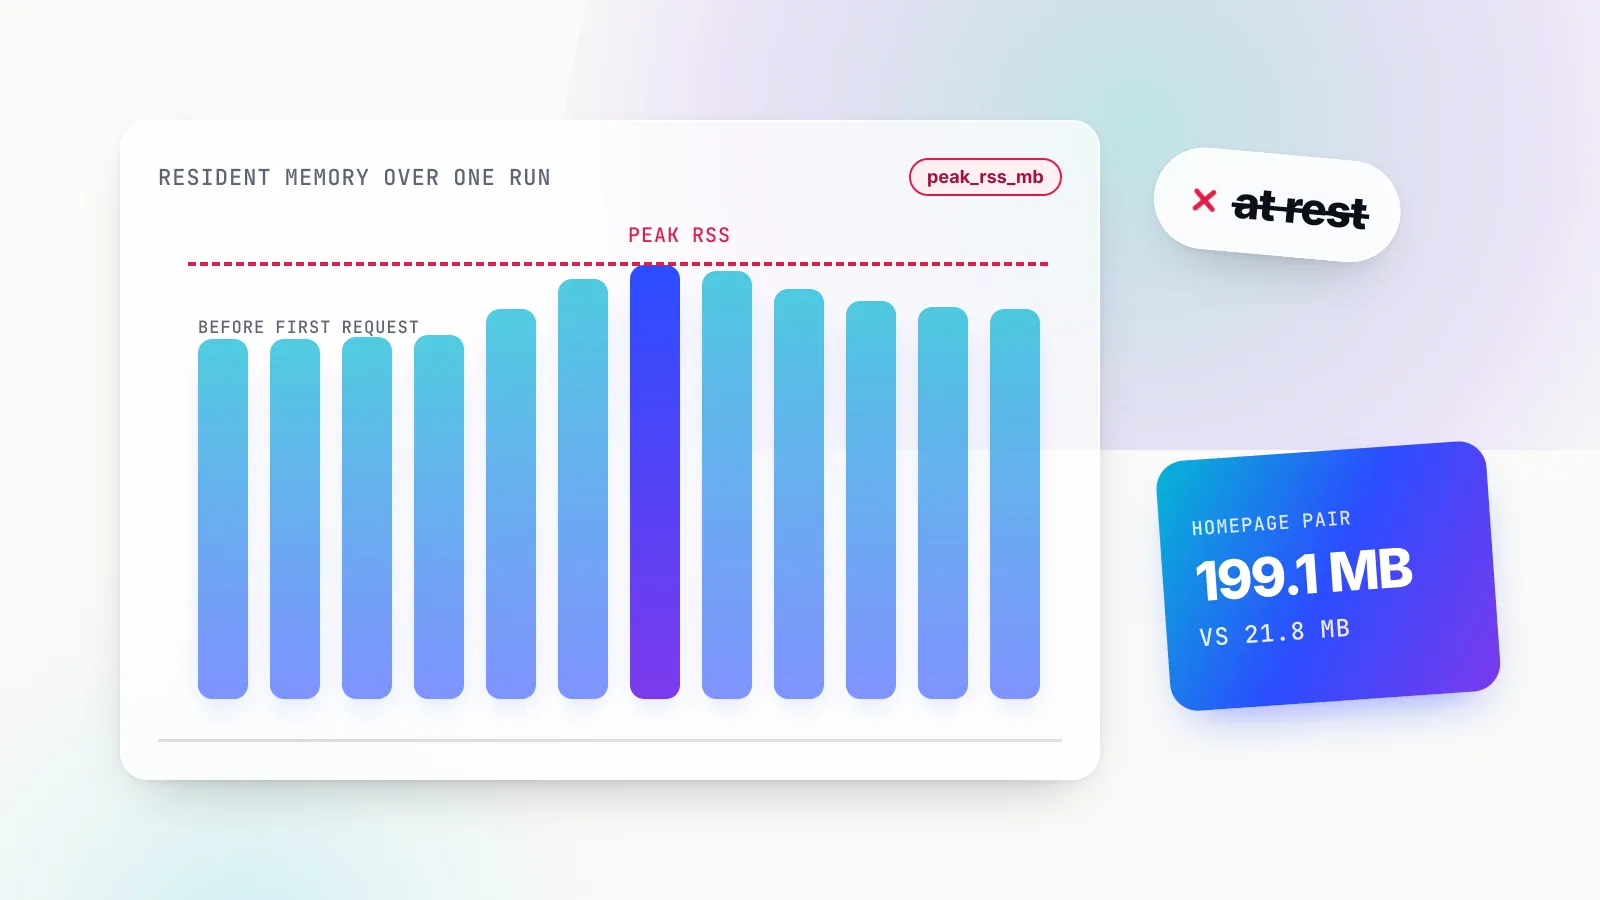
LiteLLM Rust recorded lower peak RSS in three of four published file sets; Bifrost was lower in the ceiling run at 242.6 MB versus 297.1 MB for Rust. The ceiling results report 0.242614272 GB for Bifrost and 0.29710336 GB for Rust, converted here to decimal MB. The other three sets favor Rust: 21.8 MB versus 199.1 MB in the messages/release capture; 26.1 MB versus about 144 MB in the earlier memory capture; and roughly 35–36 MB versus 282–298 MB in the CPU time series. These are different measurements, not repeated trials of one identical setup.
The ceiling file also records Rust at 21.075% average CPU and 2,814.35 RPS. The separate CPU time series records a much lower average over its own sampling window. The figures must retain their file and workload context.
The Bifrost post identifies v1.6.4 as the tested build and infers default-on logging from v2.4.0 code; it explicitly says that behavior was not yet confirmed on v1.6.4. Neither the blog nor the benchmark files quantify logging’s share of the memory or CPU difference.
The throughput figures in LiteLLM’s concurrency sweep
LiteLLM’s sweep file records throughput at four concurrency levels for a direct call and three gateways. At every level, LiteLLM Rust and Bifrost sit within 1% of each other, and both stay close to the direct baseline. The LiteLLM Python proxy falls far behind from concurrency 4 upward. The figures below come from LiteLLM’s own latency_vs_concurrency.csv.
| Concurrency | Direct (RPS) | LiteLLM Rust (RPS) | Bifrost (RPS) | LiteLLM Python (RPS) |
|---|---|---|---|---|
| 1 | 46.2 | 45.2 | 44.8 | 34.4 |
| 4 | 184.5 | 181.2 | 180.2 | 92.7 |
| 16 | 735.6 | 721.8 | 722.7 | 158.4 |
| 64 | 2,855.7 | 2,722.2 | 2,719.1 | 179.8 |
Requests per second, higher is better. Source: LiteLLM’s ai-gateway-bench repo, as of November 1, 2026. All error counts are 0.
Three things stand out in the table.
The two compiled gateways trade places. Rust is ahead at concurrency 1, 4 and 64; Bifrost is ahead at concurrency 16 (722.7 vs 721.8). The gaps are 44.8 vs 45.2 at concurrency 1, 180.2 vs 181.2 at 4, and 2,719 vs 2,722 at 64, about 0.1% lower. None of them reaches 1%.
Both stay close to the direct baseline. At concurrency 64, Bifrost keeps 95.2% of direct throughput and Rust 95.3%. That is the figure that describes the gateways’ cost in capacity, in this setup.
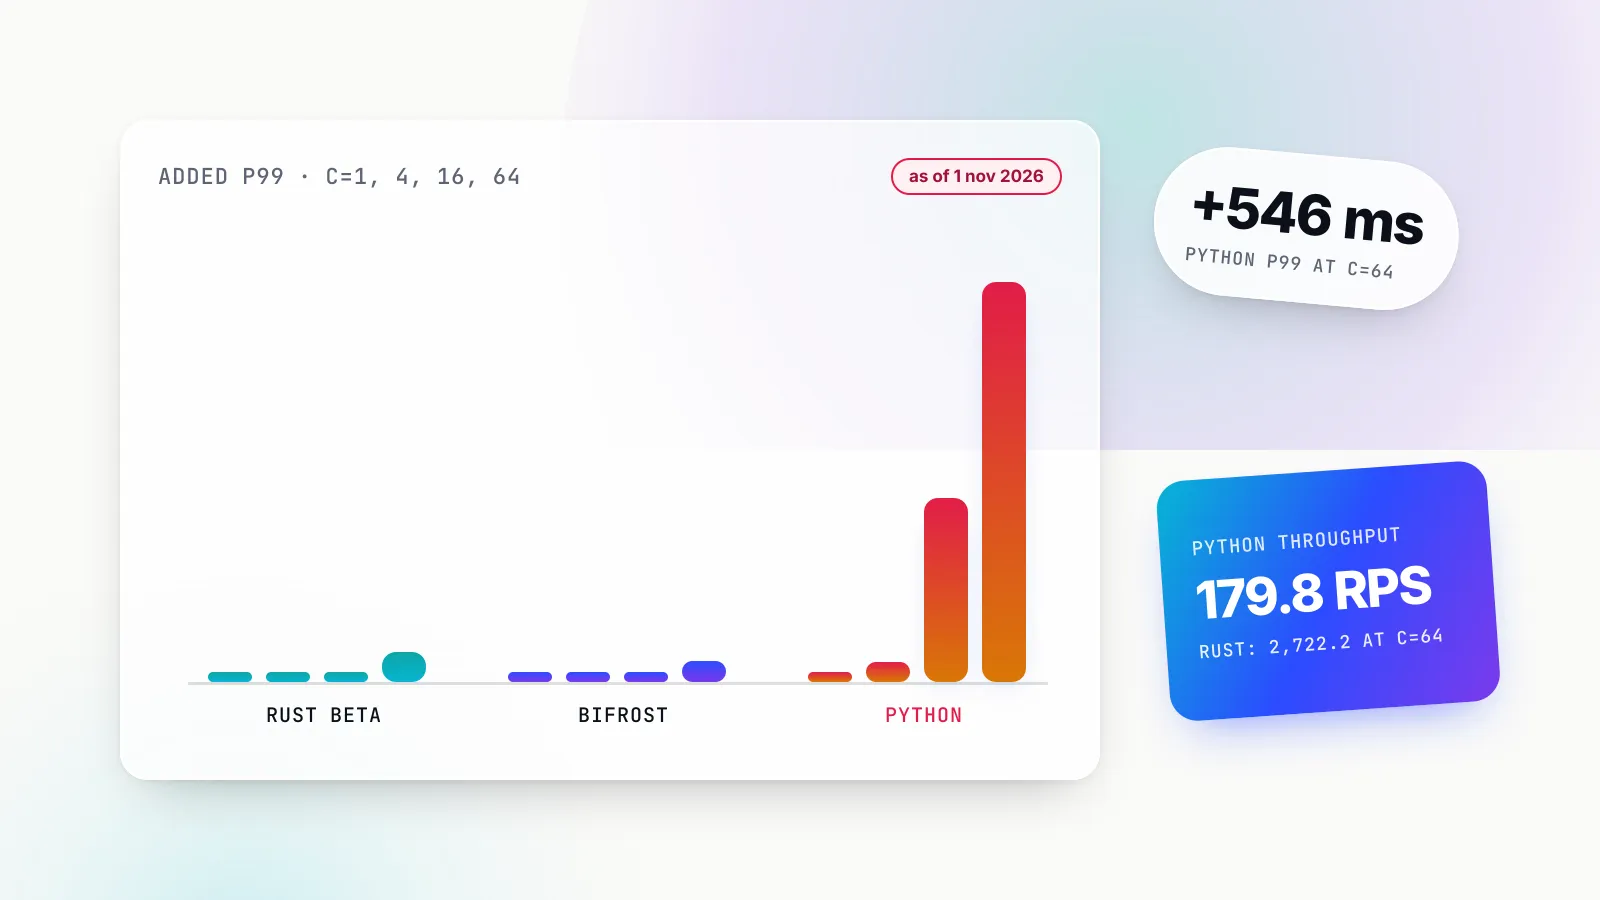
The Python proxy is the outlier. It reaches 179.8 requests per second at concurrency 64, which is 6% of direct. It also adds 546.04 ms of p99 latency at that level, about 13.6x the Rust port’s added latency.
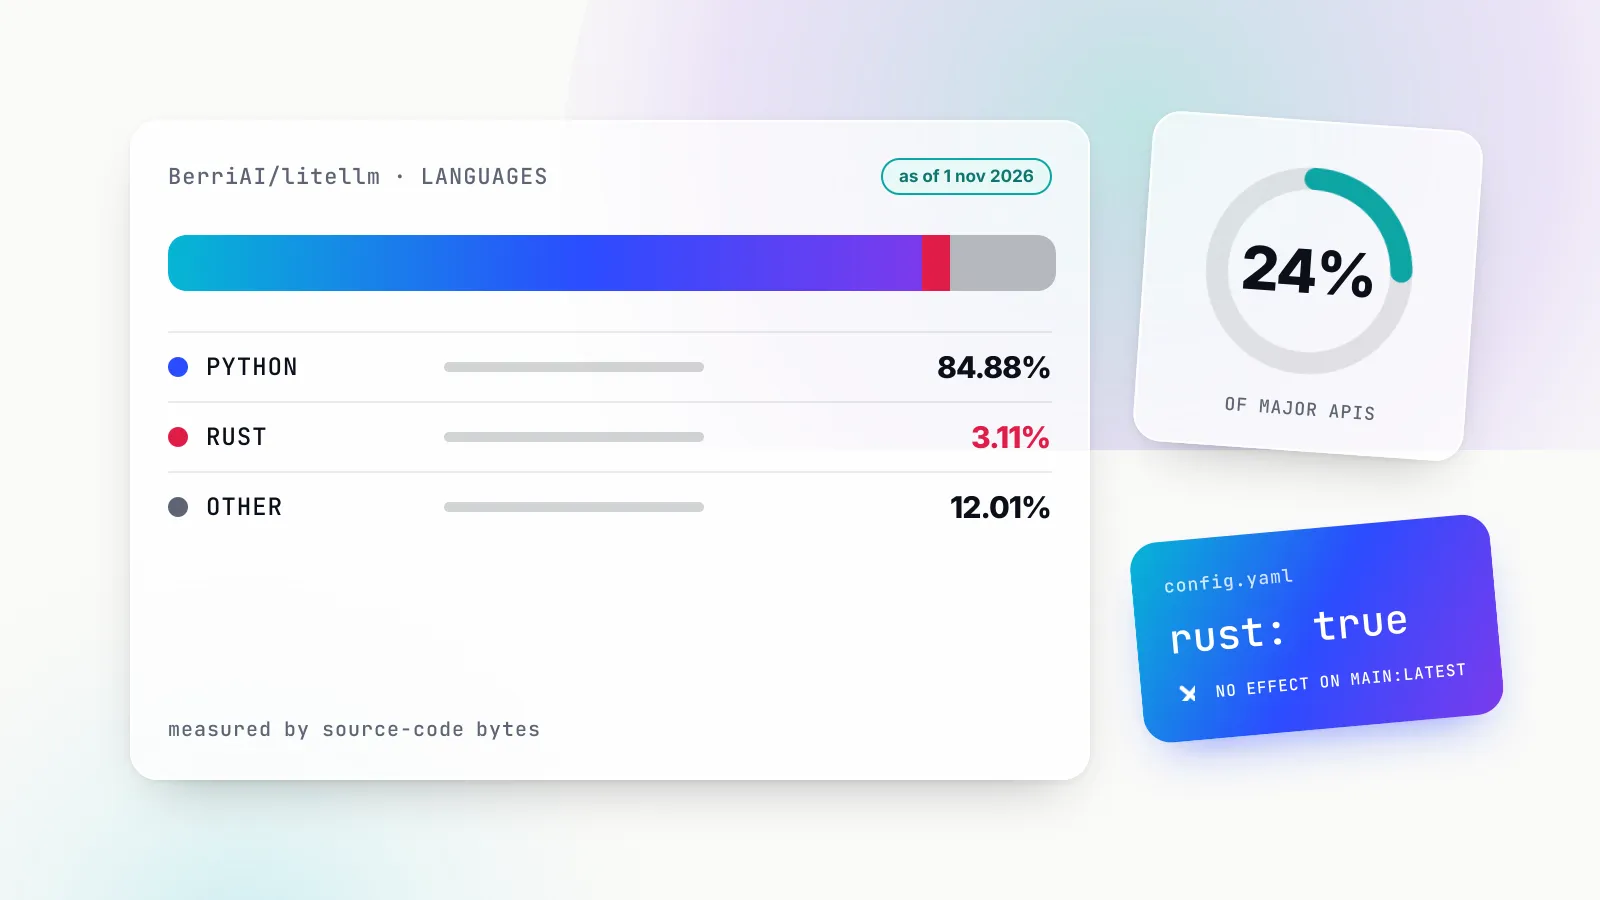
The Python result matters for anyone running LiteLLM today. LiteLLM’s Rust gateway documentation warns that on main:latest, Chat Completions and Messages still run on the Python proxy, which GenAI Brief covered in whether LiteLLM is written in Rust yet. The Rust row describes a beta; the Python row measures the tested Python proxy; it does not predict the speed of another deployment.
What requests per second measures
Requests per second is the number of requests a system completes, divided by the wall-clock time taken to complete them. In a gateway benchmark it is a measure of capacity under a specific load, not a property of the gateway alone. The same binary produces different RPS figures at different concurrency levels, against different upstreams and with different features switched on.
Google’s Site Reliability Engineering book lists traffic as one of the four golden signals of monitoring and notes that for a web service it “is usually HTTP requests per second”. That is the production view: how much demand the system is serving. A benchmark turns it around and asks how much demand the system can serve before something gives.
Concurrency sets the load
A concurrency level, in the usual sense, is the number of requests kept in flight at once. At concurrency 1, the load driver sends a request, waits for the response and sends the next. At concurrency 64, there are 64 requests outstanding at any moment. Throughput rises with concurrency as long as the system has spare capacity, because more work overlaps in time.
LiteLLM’s table shows exactly that shape for the direct call: 46.2 requests per second at concurrency 1, then 184.5, 735.6 and 2,855.7 as concurrency rises to 4, 16 and 64. Each step multiplies concurrency by four, and direct throughput rises roughly in step. Rust and Bifrost track the same curve. The Python proxy stops tracking it after concurrency 4: 92.7, then 158.4, then 179.8.
Little’s law links the three numbers
Throughput, latency and concurrency are not independent. Little’s law, a result from queueing theory, states that the average number of items in a stable system equals the arrival rate multiplied by the average time each item spends inside. For a benchmark that holds concurrency fixed, that means throughput is roughly concurrency divided by mean response time.
The practical consequence is that a throughput number and a latency number from the same run are two views of one system. If concurrency rises and throughput stops rising, mean response time must be rising instead. That is what the Python row shows between concurrency 16 and 64: four times as many requests in flight, only a modest gain in completed requests per second, and a large increase in latency.
Little’s law speaks about averages. It says nothing about the slowest requests, which is why a benchmark that reports only throughput, or only mean latency, hides the part of the distribution that users notice first.
The direct baseline is the reference
In a gateway benchmark, the direct call is the same request sent straight to the upstream with no gateway in between. Everything the gateway does, from parsing and translation to logging and plugin hooks, sits on top of that path. The direct row is the reference for this controlled test. It is not a universal physical ceiling: any higher gateway result would require checking caching, connection behavior and load-generator conditions before drawing a conclusion.
That is why “percentage of direct” is a more useful framing than raw RPS when comparing gateways in one run. At concurrency 64, 95.2% for Bifrost and 95.3% for Rust say the same thing: both gateways keep about 95% of the upstream’s capacity in this setup, and the gap between them is far too small to rank.
What RPS leaves out
A requests-per-second figure carries no information about four things an operator needs:
- Errors. A gateway that fails fast can post a high RPS. LiteLLM’s sweep reports zero errors in every cell, which makes the figures comparable on that axis.
- The upstream. The benchmark ran against a simulated upstream, the same one for every gateway, according to LiteLLM’s blog. Real model calls take far longer, so the gateway’s share of total time shrinks.
- Configuration. RPS measures the work the gateway was configured to do. Two gateways doing different work produce figures that are not like-for-like, a point covered below.
- Tail behaviour. RPS is an average over the run. It does not say how long the slowest requests took.
Why single-run gaps under 1% do not establish a ranking
A benchmark result is one sample from a distribution. Run the same benchmark again on the same machine and the numbers move, because operating-system scheduling, CPU frequency scaling, memory allocation, garbage collection, network-stack buffering and background processes all vary from one run to the next. A gap between two gateways only means something if it is larger than that run-to-run variation, and the only way to know how large the variation is, is to run the benchmark more than once.
LiteLLM’s sweep does not do that. Each cell looks like one run, with no repeats or error bars published. LiteLLM’s own benchmark blog post describes the setup as “single-host, per-scenario runs (for example n=5000 on the overhead panel) without repeated-trial error bars” and advises readers to “treat them as order-of-magnitude differences”. A 0.1% throughput gap at concurrency 64 is nowhere near an order-of-magnitude difference.
With one run per cell and no confidence intervals, the statistical significance of these throughput gaps is unknown. That limitation applies in both directions: neither Bifrost’s narrow lead at concurrency 16 nor Rust’s narrow lead at concurrency 64 establishes a consistent ranking.
The files disagree with each other
The clearest evidence that small gaps are unstable comes from LiteLLM’s own repo. The sweep file and the rps_per_dollar.csv file both record a concurrency-64 result for each gateway, and they do not agree.
| Measure at concurrency 64 | Source file | LiteLLM Rust | Bifrost |
|---|---|---|---|
| Throughput (RPS) | latency_vs_concurrency.csv | 2,722.2 | 2,719.1 |
| Throughput (RPS) | rps_per_dollar.csv | 2,814 | 2,744 |
| Total p99 (ms) | latency_vs_concurrency.csv | 64.3 | 52.7 |
| Total p99 (ms) | rps_per_dollar.csv | 26.9 | 32.2 |
Figures from LiteLLM’s ai-gateway-bench repo as of November 1, 2026. Lower p99 is better; higher RPS is better.
The same gateway, at the same nominal concurrency, posts different throughput and very different p99 in two files from one benchmark. In the sweep, the Go gateway has the lower total p99; in the cost file, Rust does. With single runs, small gaps are not stable, and the ranking flips between LiteLLM’s own files. The blog admits the limitation; the homepage tiles do not repeat it.
What would make a gap meaningful
A throughput difference becomes a finding when three conditions hold:
- Repeated trials. Several runs per cell, ideally interleaved across gateways so that drift in the machine affects all of them equally.
- A measure of spread. Error bars, a standard deviation or a confidence interval for each cell, so a reader can see whether two ranges overlap.
- The same work. Both gateways configured to do the same job, on the same versions a reader would deploy, on stated hardware.
LiteLLM’s sweep meets none of the three as published. Maxim says its proposed follow-up retest will use a current Bifrost build, repeated trials and error bars, and publish hardware, worker counts, simulated-upstream latency and concurrency for every run. Until then, a throughput ranking between the two compiled gateways is not supported by the data.
GenAI Brief has written about the wider pattern of vendor-run results presented without their caveats in how benchmarks became a marketing channel. The throughput tie is a small, clean example: the caveat is in the blog, the data is in the repo, and the tile omits both.
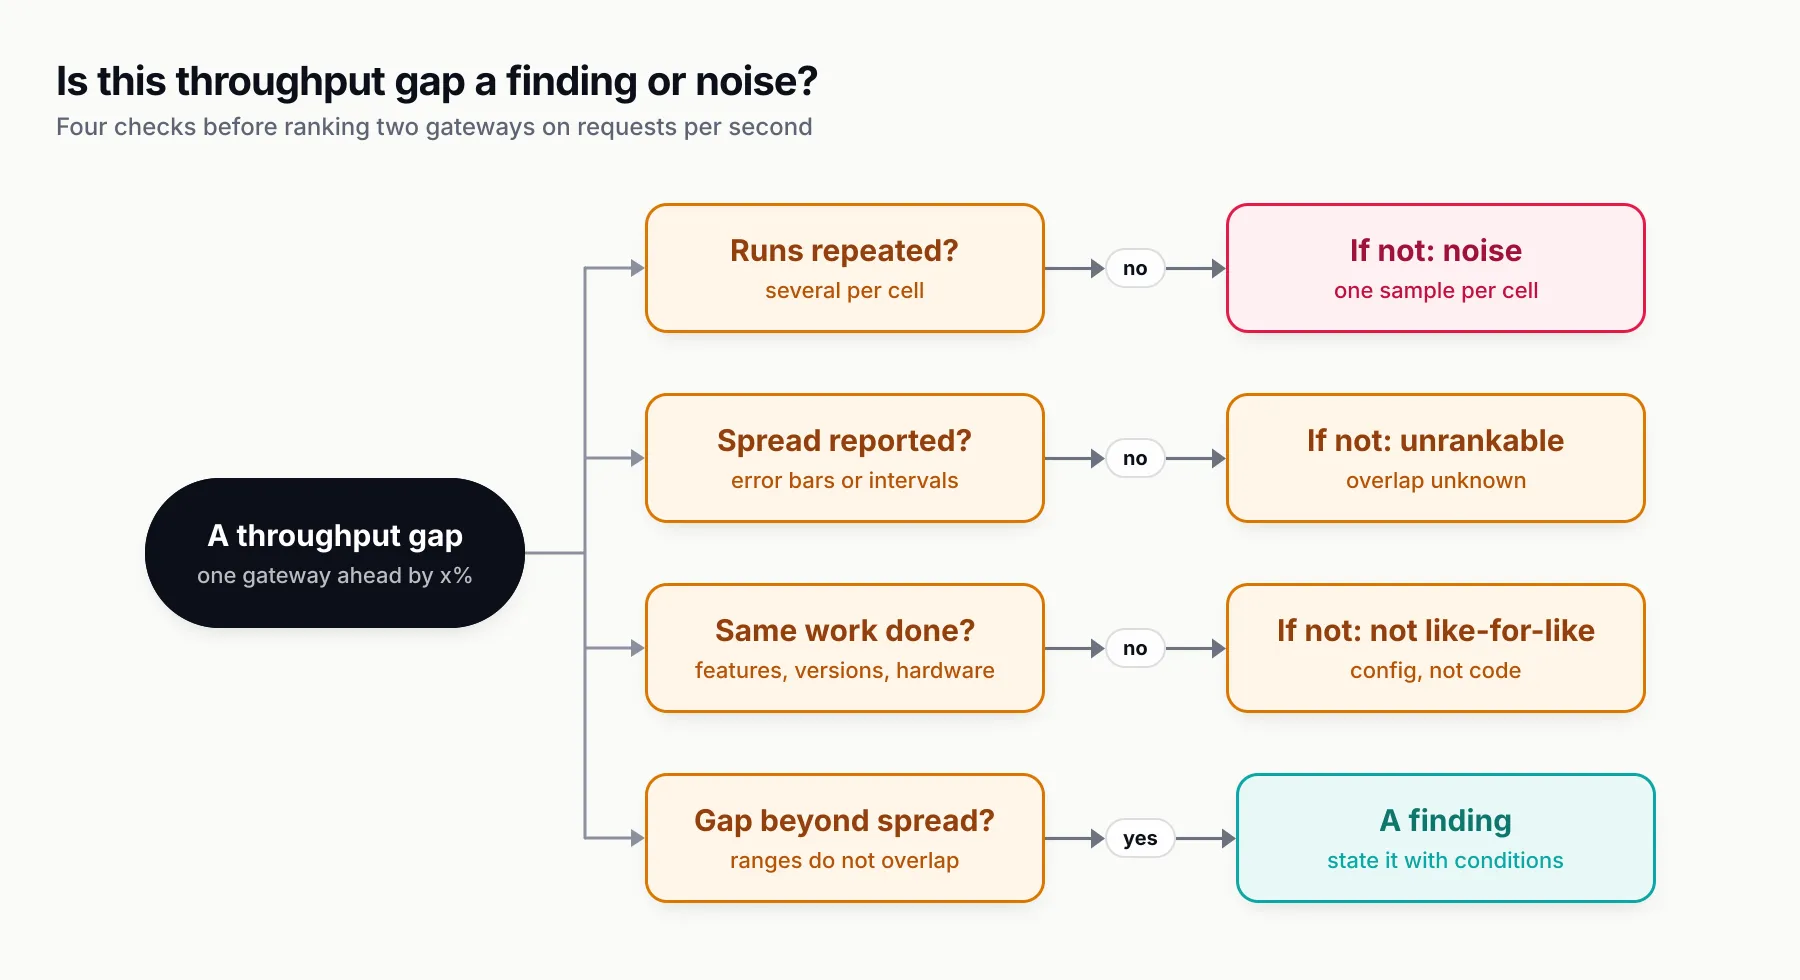
Figure 1: A throughput gap is a finding only after these checks. LiteLLM’s sweep, as published, stops at the first one.
How throughput and latency interact under load
Throughput and latency respond to load at different speeds. As concurrency rises, latency at the tail usually moves first, because requests start waiting in queues before the system’s completion rate stops growing. Throughput moves last: it can keep climbing, or hold steady, while the slowest requests get much slower. That is why two gateways can tie on requests per second and still differ on p99.
The Google SRE book makes the same point from the operations side: “Latency increases are often a leading indicator of saturation.” It recommends watching the 99th percentile response time over a short window as an early signal. A throughput figure alone gives no such warning.
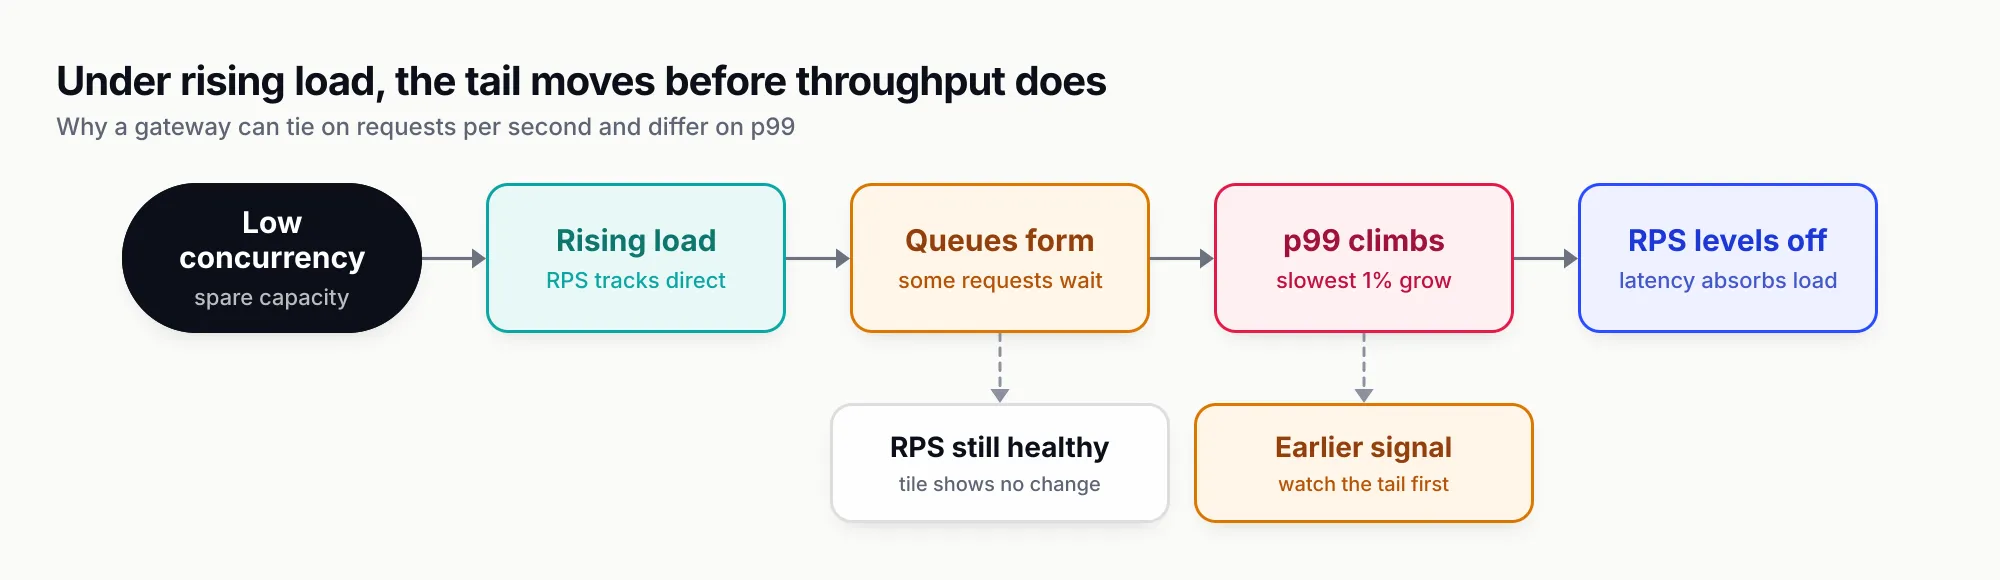
Figure 2: Under rising load the tail grows before throughput stops. A throughput tile shows the last stage, not the first.
What the sweep shows at concurrency 64
LiteLLM’s sweep pairs every throughput figure with an added p99 figure: the gateway’s p99 minus the direct call’s p99, in milliseconds. Read together, they show the gateways diverging on the tail while tying on throughput.
| Concurrency | Rust added p99 (ms) | Bifrost added p99 (ms) | Python added p99 (ms) | Rust RPS | Bifrost RPS |
|---|---|---|---|---|---|
| 1 | +0.89 | +0.75 | +9.79 | 45.2 | 44.8 |
| 4 | +0.61 | +0.63 | +26.95 | 181.2 | 180.2 |
| 16 | +0.33 | +0.89 | +251.34 | 721.8 | 722.7 |
| 64 | +40.28 | +28.68 | +546.04 | 2,722.2 | 2,719.1 |
Source: LiteLLM’s latency_vs_concurrency.csv as of November 1, 2026. Direct p99 was 21.98, 22.42, 22.67 and 24.02 ms at the four levels.
From concurrency 1 to 16, both compiled gateways add under a millisecond of p99, and throughput tracks the direct call. At concurrency 64 the picture changes. Both gateways still deliver about 95% of direct throughput, but their added p99 jumps to +40.28 ms for Rust and +28.68 ms for Bifrost, about 29% less for the Go gateway. The throughput tile would show two near-identical bars; the tail tells a different story at the same load.
The tail results are mixed. Bifrost adds less p99 than Rust at concurrency 1 and 64. Rust is lower at concurrency 16 (+0.33 vs +0.89 ms, a 0.56 ms difference that is about 2.4% of total p99). At concurrency 4 the gap is 0.02 ms, whose significance is unknown without repeated trials. The same single-run caveat applies to these numbers as to throughput.
Saturation in the Python row
The LiteLLM Python proxy shows what saturation looks like in both metrics at once. Its throughput goes from 92.7 to 158.4 to 179.8 requests per second as concurrency rises from 4 to 16 to 64, while its added p99 goes from +26.95 ms to +251.34 ms to +546.04 ms. More requests in flight buy almost no extra throughput and a great deal of extra waiting. By Little’s law, that is what a system at its limit has to do: when completion rate stops rising, time in the system absorbs the extra load.
The compiled gateways have not reached that point at concurrency 64 in this benchmark, which is why both still track the direct call on throughput. Their rising p99 at that level is the earlier signal the SRE book describes.
Concurrency 256 is where Rust leads
LiteLLM’s repo also holds a result at concurrency 256, and it is the one place where the Rust gateway clearly leads on latency. The files record p50 of 55.5 ms for Rust and 89.3 ms for Bifrost, and p99 of 2,667.8 ms for Rust against 5,421.3 ms for Bifrost, with direct at 48.1 ms p50 and 434.8 ms p99. Rust is about 1.6x better at p50 and about 2.0x better at p99.
Three caveats travel with that result. The repo README says concurrency 256 was dropped from the sweep because the direct baseline’s p99 exceeded twice the single-client floor. The JSON files in the results directory hold one run of 5,000 requests per gateway. And there is no RPS field, so there is no throughput figure at 256 to compare. That makes it an exploratory result rather than a reliable capacity comparison. It is still a result worth stating plainly: at the highest load in LiteLLM’s files, Rust’s latency is lower.
Resource use is a separate axis
Throughput ties do not mean resource ties. In LiteLLM’s files, the Rust gateway uses less CPU, a mean of 0.66% against 2.59% for Bifrost in cpu_bifrost.csv (peaks of 15.9% and 79.5%), and lower peak RSS in three of four published file sets: the ceiling file instead records Rust at 297.1 MB and Bifrost at 242.6 MB. Both are whole-process measurements under the configurations described below. GenAI Brief covered the memory figures and what they do and do not show in LiteLLM’s “9x less memory” figure.
For capacity planning the distinction matters. Two gateways that deliver the same requests per second on the same hardware can need different amounts of CPU and memory to do it, and that difference, not the throughput figure, is what a resource budget turns on.
Reading the homepage throughput tile
LiteLLM’s homepage benchmark section shows the Rust gateway at “2,800+ req/s” and leaves Bifrost’s throughput cell as a dash, as of November 1, 2026. LiteLLM’s own files hold a Bifrost figure for that comparison. In rps_per_dollar.csv, Bifrost records 2,744 requests per second and Rust 2,814; in the sweep at concurrency 64, they record 2,719 and 2,722.
The effect is that the blank cell hides a gap of 2.5% or less, 2.5% in one file and 0.1% in the sweep. The tile does not show that the gateway beside Rust was within a few per cent on throughput in both files.
| What the tile shows | What LiteLLM’s files show | Reading |
|---|---|---|
| Rust “2,800+ req/s” | 2,814 RPS in rps_per_dollar.csv; 2,722.2 in the sweep at concurrency 64 | Consistent with the cost file’s 2,814 |
| Bifrost cell is a dash | 2,744 RPS in rps_per_dollar.csv; 2,719.1 in the sweep at concurrency 64 | A Bifrost figure exists in both files |
| Gap not shown | 2.5% in one file, about 0.1% in the other | A gap of 2.5% or less, from single runs |
| Footnote: “single client” | Sweep runs concurrency 1 to 64; throughput point uses ceiling_concurrency = 64 | Not one connection at a time |
| Footnote: “at ~21% CPU” | throughput_ceiling.csv records 21.075% average CPU at 2,814.35 RPS for Rust | Supported by the ceiling file |
Figures as of November 1, 2026, from litellm.ai and LiteLLM’s ai-gateway-bench repo.
The footnote’s “single client”
The tile’s footnote describes the throughput as measured with a “single client”. That description is not supported as stated, because the sweep runs from concurrency 1 to 64 and the throughput point in rps_per_dollar.csv uses ceiling_concurrency = 64. A reader who takes “single client” to mean one request at a time would expect a figure near the concurrency-1 row, about 45 requests per second, not 2,800.
The separate throughput-ceiling file records LiteLLM Rust at 2,814.35 requests per second and 21.075% average CPU, so it supports the rounded 2,800+ RPS at approximately 21% CPU figure. The 0.66% mean and 15.9% peak in cpu_rust.csv belong to a different sampling series and should not be substituted for that ceiling-run measurement. Published ceiling results.
Questions to ask of any throughput tile
The LiteLLM tile is one instance of a format that appears on many infrastructure product pages. Before quoting a throughput number from any of them, an engineer can ask:
- At what concurrency? A requests-per-second figure without a concurrency level has no denominator. The same gateway in LiteLLM’s sweep runs at about 45 or about 2,700 depending on the level.
- How many runs, and what spread? One run cannot separate a real difference from noise.
- Against what baseline? Percentage of direct throughput is comparable across setups; raw RPS against an unstated upstream is not.
- With which features on? Logging, persistence and plugins change the work done per request.
- Which versions? A beta against an old build of the other product says little about current releases.
- On what hardware? Without core and worker counts, nobody can reproduce the figure.
- With which latency figures? Throughput without p50 and p99 at the same load hides the tail.
- Where are all the comparators? A blank cell next to a highlighted number is a missing data point, not a result.
LiteLLM’s homepage states “identical hardware” and invites readers to “run it yourself”, but gives no machine type, core count or worker count for either gateway, and its “See the benchmark” link goes to the in-page anchor rather than the raw data or a methodology document.
The configuration behind the throughput numbers
The throughput tie happened under configurations that were not like-for-like. If the inference below holds, the Go gateway was doing more work per request than the Rust gateway. LiteLLM’s blog says every gateway ran “with no logging callbacks, spend tracking, or persistence enabled”. The published Bifrost configuration appears to leave logging on by default, an inference from v2.4.0 code that is not yet confirmed on v1.6.4.
What the Bifrost config sets
LiteLLM’s Bifrost configuration sets a simulated upstream, config_store: enabled: false and no plugins. It never sets logs_store or enable_logging. In Bifrost’s v2.4.0 code, enable_logging defaults to true when unset, a missing logs_store creates a default SQLite log store, and the logging plugin is built in, so “no plugins” does not switch it off. disable_content_logging defaults to false, so request and response bodies are logged too. Telemetry, governance, routing and compat plugins also load by default in the open-source build.
Bifrost’s current client configuration documentation lists enable_logging (“Log all LLM requests and responses”) and disable_content_logging (default false) among the client settings, which is where a team would turn logging off for a like-for-like run.
The hedge has to travel with the finding: the logging-on reading is inferred from v2.4.0 code and not confirmed on v1.6.4. If it holds, the Go gateway’s 2,719.1 requests per second at concurrency 64 included log buffering and SQLite writes that LiteLLM reports switching off for its own gateway. A controlled rerun is needed to measure how much those writes cost, and disabling logging alone does not remove other plugins’ hooks.
Versions and scope
The benchmark compared Bifrost v1.6.4 with a LiteLLM Rust beta. Bifrost’s changelogs list v1.6.5 to v1.6.11 and then v2.0.0 to v2.4.0 since that build, and LiteLLM’s blog describes its Rust gateway as “an early beta, streaming and the full feature surface are still landing”. Bifrost was also called on its native /anthropic/v1/messages route, because the gateway’s README in LiteLLM’s repo says v1.6.4 does not mount that integration at /v1/messages.
None of this changes the throughput numbers; it changes what they describe. The tie is between an old build of the Go gateway that appears to have had logging on and a Rust beta with persistence off and streaming not yet landed, both in front of a simulated upstream on one host. That is a narrow result. It is still a useful one, because it shows the beta reaching the throughput level the older Go build already had.
A throughput benchmark method engineers can run
A gateway throughput benchmark that supports a ranking has a direct baseline, a concurrency sweep, repeated runs with reported spread, matched configurations, and latency percentiles reported beside requests per second. Most of that is a matter of discipline rather than tooling, and it can be run with any load generator that holds concurrency fixed and records per-request timings.
A minimal method
- Fix the upstream. Use a simulated upstream with a known, stable response time for gateway overhead, and a real provider separately if end-to-end figures matter. Record the upstream’s own latency.
- Measure direct first. Run the same load straight at the upstream to get the ceiling for each concurrency level.
- Sweep concurrency. Step through levels that bracket production load, and keep going until the direct baseline itself starts to degrade, which is where LiteLLM’s sweep stopped.
- Repeat and interleave. Run each cell several times, alternating gateways, and report the spread for each cell.
- Match the work. Configure every gateway with the same features: logging off for all, then logging on for all. Report both.
- Report the whole picture. Requests per second, percentage of direct, p50, p99, error count, CPU and memory, versions, hardware, worker counts and the load generator’s settings, for every cell.
Maxim describes its proposed follow-up retest with the same outline: both gateways with logging off and again with logging on, a current Bifrost build, repeated trials and error bars, published hardware, worker counts, simulated-upstream latency and concurrency for every run, and a heap profile for memory.
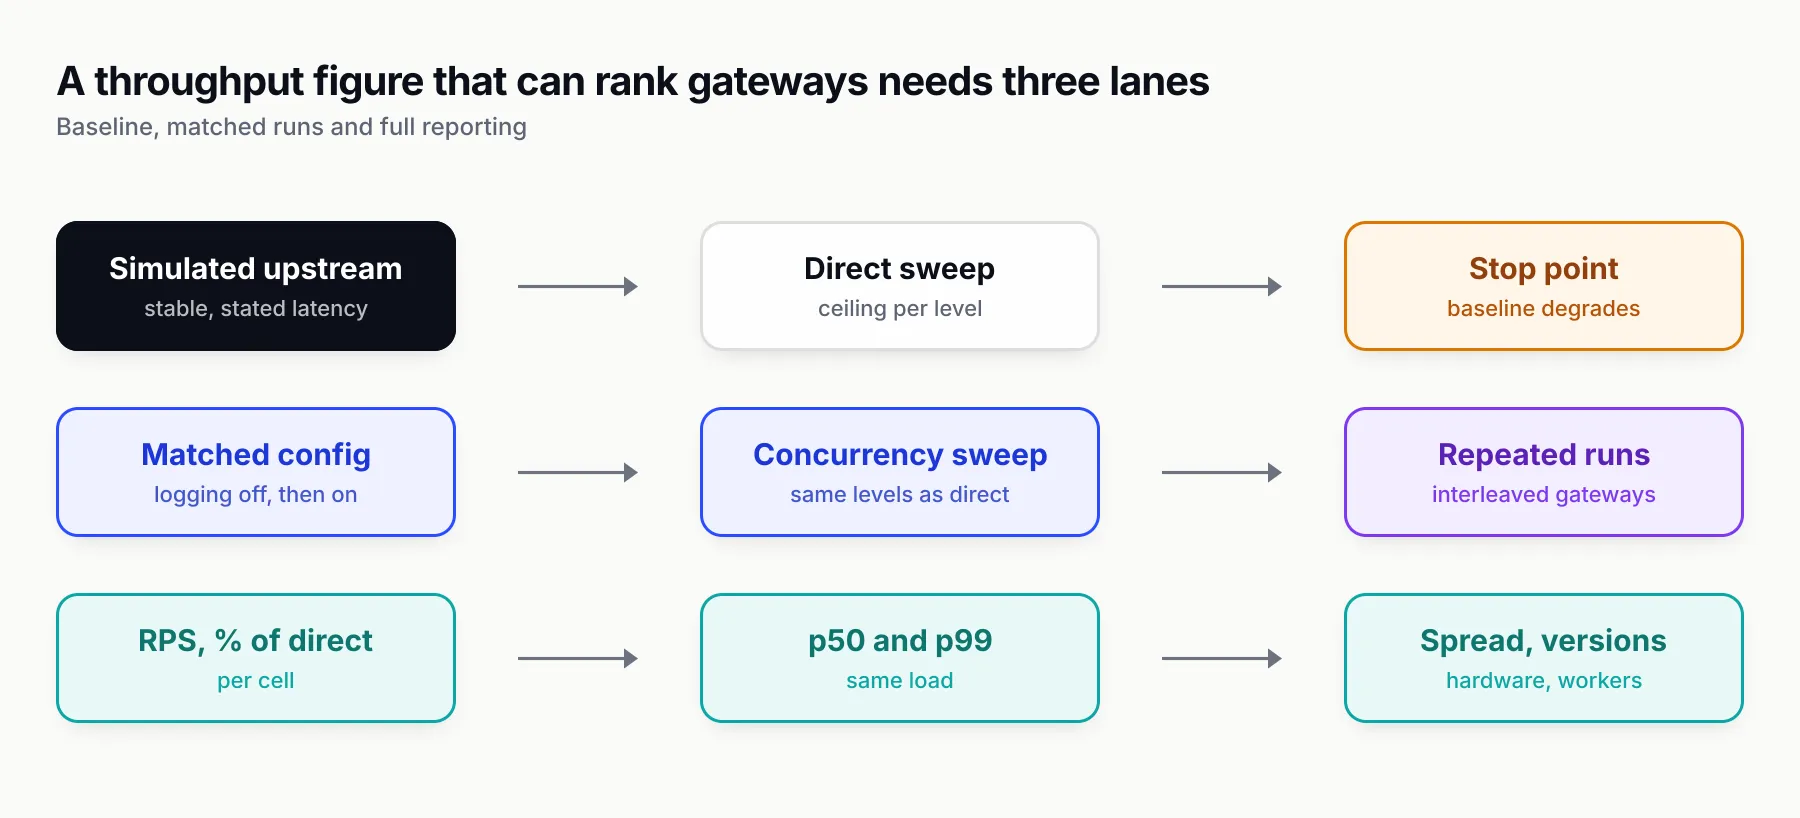
Figure 3: A throughput figure that can rank two gateways needs all three lanes. Most vendor tiles publish only the end of the middle one.
Worked examples
A team at low concurrency. An internal tool sending a handful of requests at a time sits in the concurrency 1 to 4 range of the sweep. Both compiled gateways deliver throughput close to direct there, and add under a millisecond of p99. For this team, the observed throughput gap may be less important than other requirements; the choice turns on features and operations.
A team with high fan-out. An agent platform that keeps dozens of model calls in flight per node is closer to the concurrency-64 row. Throughput still ties, but added p99 diverges, and at concurrency 256 the exploratory result favours Rust on latency. This team should benchmark at its own concurrency, with repeated runs, and weight p99 at least as heavily as RPS.
A team that needs request logs. For a team that must keep a record of every request, a benchmark with logging off is not the configuration it will run. The relevant comparison is both gateways with logging on, which the published benchmark does not contain.
A team on the LiteLLM Python proxy today. The Python row, 179.8 requests per second and +546.04 ms of added p99 at concurrency 64, measures the tested Python proxy, rather than all current deployments, given that Chat Completions and Messages still run on Python in main:latest. The Rust and Bifrost rows describe what a compiled gateway path can do in this setup, not what an existing LiteLLM proxy delivers.
Where Bifrost fits
For teams evaluating Bifrost, an open-source AI gateway written in Go, the documented client settings above are the levers for matching configurations in a benchmark: enable_logging controls the built-in logging plugin, and disable_content_logging strips message content from the log store while keeping metadata.
For the architectural background on why a gateway sits in the request path at all, GenAI Brief’s explainer on what an AI gateway is covers the components that add work per request.
What engineers should take from the throughput tie
On throughput, LiteLLM’s published data supports one conclusion: the Rust beta and Bifrost v1.6.4 deliver the same requests per second within the resolution of a single-run benchmark. At concurrency 64 that is 2,722.2 against 2,719.1, both about 95% of a direct call, and every gap between them across the sweep is under 1%. The homepage’s blank Bifrost cell and “single client” footnote do not change that; they only make it harder to see.
The reported throughput is similar for the Rust beta and Bifrost; these single runs do not establish a consistent performance winner. The same files show where the Rust gateway records an advantage, on CPU, on memory and on latency at the exploratory concurrency-256 point. It is not evidence that Rust beats Bifrost on throughput, and a 0.1% gap from one run cannot become one.
The broader lesson concerns throughput vs latency. A requests-per-second figure is the last metric to move under load and the least informative on its own. The p99 at the same concurrency, the spread across repeated runs and the configuration of each gateway say far more about how a gateway will behave in production. Any throughput tile, from any vendor, is worth reading with the eight questions above before it is quoted.
If Maxim’s proposed follow-up retest publishes repeated trials with logging on and off, the throughput comparison can be settled properly. Until then, the accurate sentence is short: “In LiteLLM’s sweep, as of November 1, 2026, LiteLLM Rust and Bifrost tied on throughput at 2,722 and 2,719 requests per second.”
Source: Debunking LiteLLM Rust Benchmarking: Part 1, by Akshay Deo of Maxim AI, which builds the Bifrost gateway.
Sources
- Throughput ceiling results: memory, CPU and sustained RPS
- Debunking LiteLLM Rust Benchmarking: Part 1 Maxim AI
- LiteLLM homepage benchmark section LiteLLM
- Rust AI gateway benchmarks (LiteLLM blog) LiteLLM
- latency_vs_concurrency.csv (ai-gateway-bench) BerriAI (GitHub)
- rps_per_dollar.csv (ai-gateway-bench) BerriAI (GitHub)
- ai-gateway-bench README BerriAI (GitHub)
- ai-gateway-bench Bifrost gateway configuration and README BerriAI (GitHub)
- LiteLLM Rust gateway documentation LiteLLM
- Bifrost client configuration (config.json) Maxim AI
- Site Reliability Engineering, chapter 6: Monitoring Distributed Systems Google
- Little's law Wikipedia
Frequently asked questions
Which AI gateway has higher throughput, LiteLLM Rust or Bifrost?
Neither, on LiteLLM's published data. At concurrency 64 its sweep shows 2,722.2 requests per second for the Rust gateway and 2,719.1 for Bifrost. Every gap between the two is under 1%, and each figure is a single run without confidence intervals, so the difference cannot be ranked. The runs show similar throughput, without enough repeats to establish a consistent winner.
What is the difference between throughput and latency?
Throughput is how many requests a system completes per unit of time, usually reported as requests per second. Latency is how long each request takes, usually reported as percentiles such as p50 and p99. They are linked through concurrency, but they answer different questions: capacity versus the experience of an individual request.
What does requests per second mean in a benchmark?
Requests per second, or RPS, is the number of requests a system completes, divided by the wall-clock time the run took. In a gateway benchmark it only means something alongside the load that produced it: the concurrency level, the error count, the upstream used and the configuration of the gateway under test.
Can a system have high throughput and high latency at the same time?
Yes. When many requests are in flight, a system can keep completing requests at a high rate while each one waits longer in a queue. In LiteLLM's sweep, both compiled gateways kept about 95% of direct throughput at concurrency 64, while their added p99 latency rose to tens of milliseconds.
Can a single benchmark run establish a difference under 1%?
Because repeated runs of the same benchmark on the same machine rarely produce identical numbers. Without several runs and a measure of spread, such as error bars or confidence intervals, a gap smaller than the normal run-to-run variation cannot be attributed to the software. LiteLLM's sweep publishes one run per cell.
Why is Bifrost's cell blank on LiteLLM's throughput tile?
The homepage does not say. As of November 1, 2026, the tile shows Rust at '2,800+ req/s' and a dash for Bifrost. LiteLLM's rps_per_dollar.csv records 2,744 requests per second for Bifrost and 2,814 for Rust, a gap of 2.5% or less.
How do you benchmark an LLM gateway's throughput?
Measure a direct-to-upstream baseline first, then sweep concurrency with each gateway in the same configuration, repeat every cell several times, and report spread alongside the mean. Publish errors, p50 and p99 next to requests per second, plus versions, hardware and which features such as logging were on.