ToolsComparison
LiteLLM Rust vs LiteLLM Python vs Bifrost: what the data means for teams running LiteLLM today
In LiteLLM's own sweep the Python LiteLLM proxy adds 546 ms of p99 at c=64 and serves 179.8 RPS, and main:latest still runs chat routes on Python.
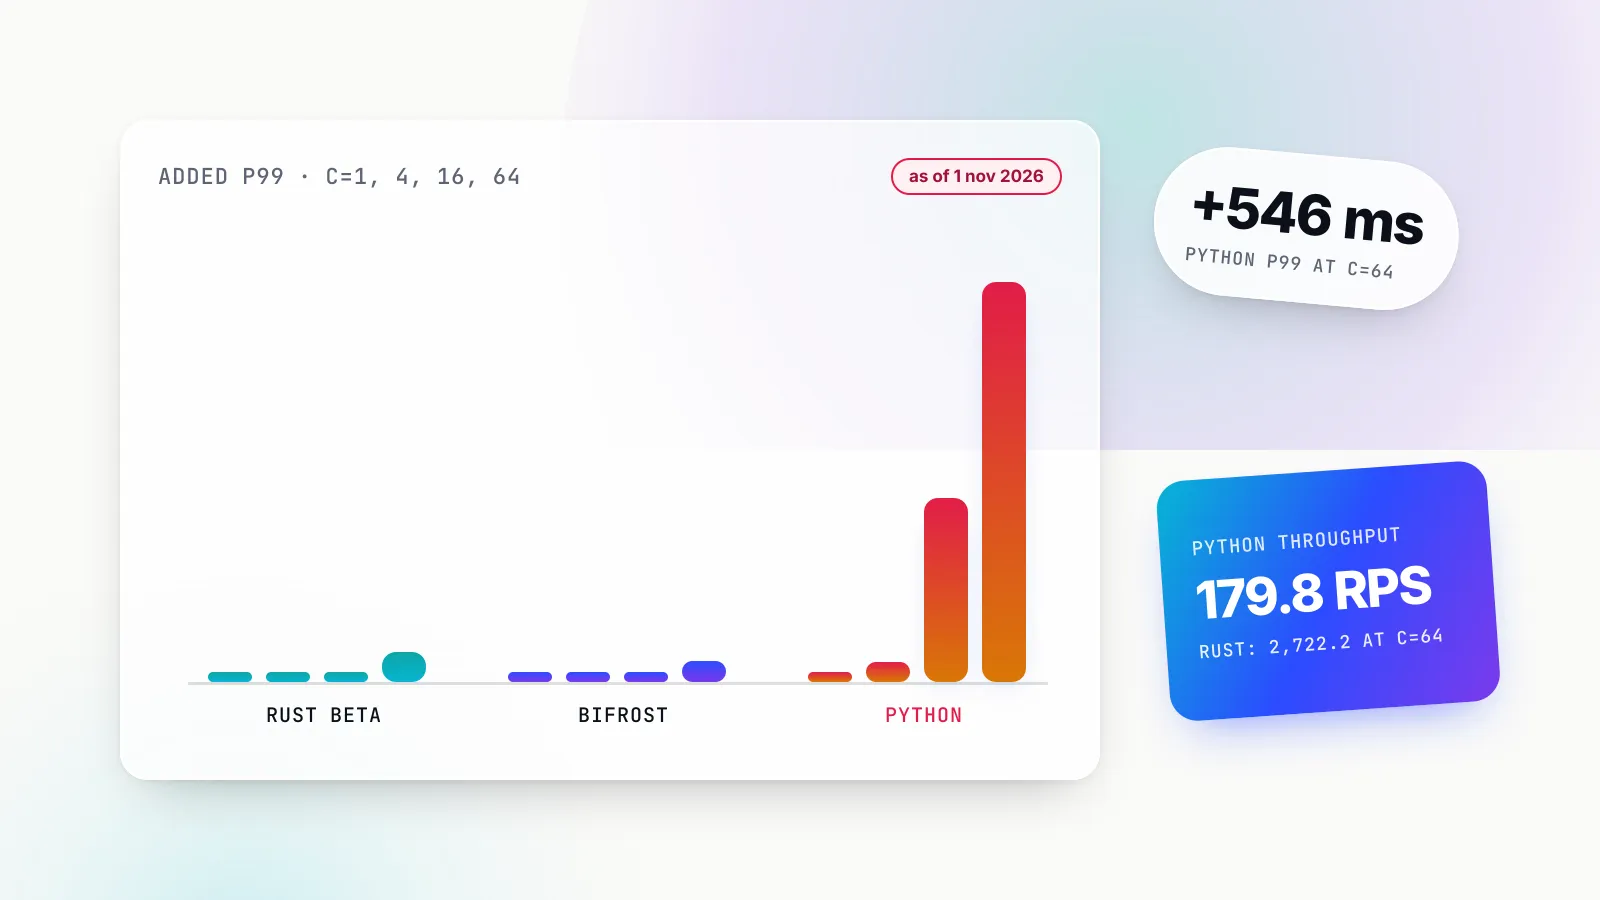
The LiteLLM proxy that most teams deploy is the Python one, and LiteLLM’s own benchmark files measure how it behaves under load next to two faster gateways. In that sweep, the Python LiteLLM proxy adds 546.04 ms of p99 latency at concurrency 64 and serves 179.8 requests per second, while LiteLLM’s Rust beta and Bifrost each add tens of milliseconds and serve about 2,720.
Source context: This analysis draws on LiteLLM’s published benchmark files and Maxim AI’s response. Maxim develops Bifrost, the competing gateway discussed here. No new performance tests were run for this article.
Correction, 5 November 2026: An earlier version omitted the throughput-ceiling file, overstated the consistency of Rust’s memory advantage, and, where discussed, incorrectly treated the approximately 21% CPU figure as unsupported. The ceiling file shows lower peak RSS for Bifrost and supports Rust’s rounded CPU figure.
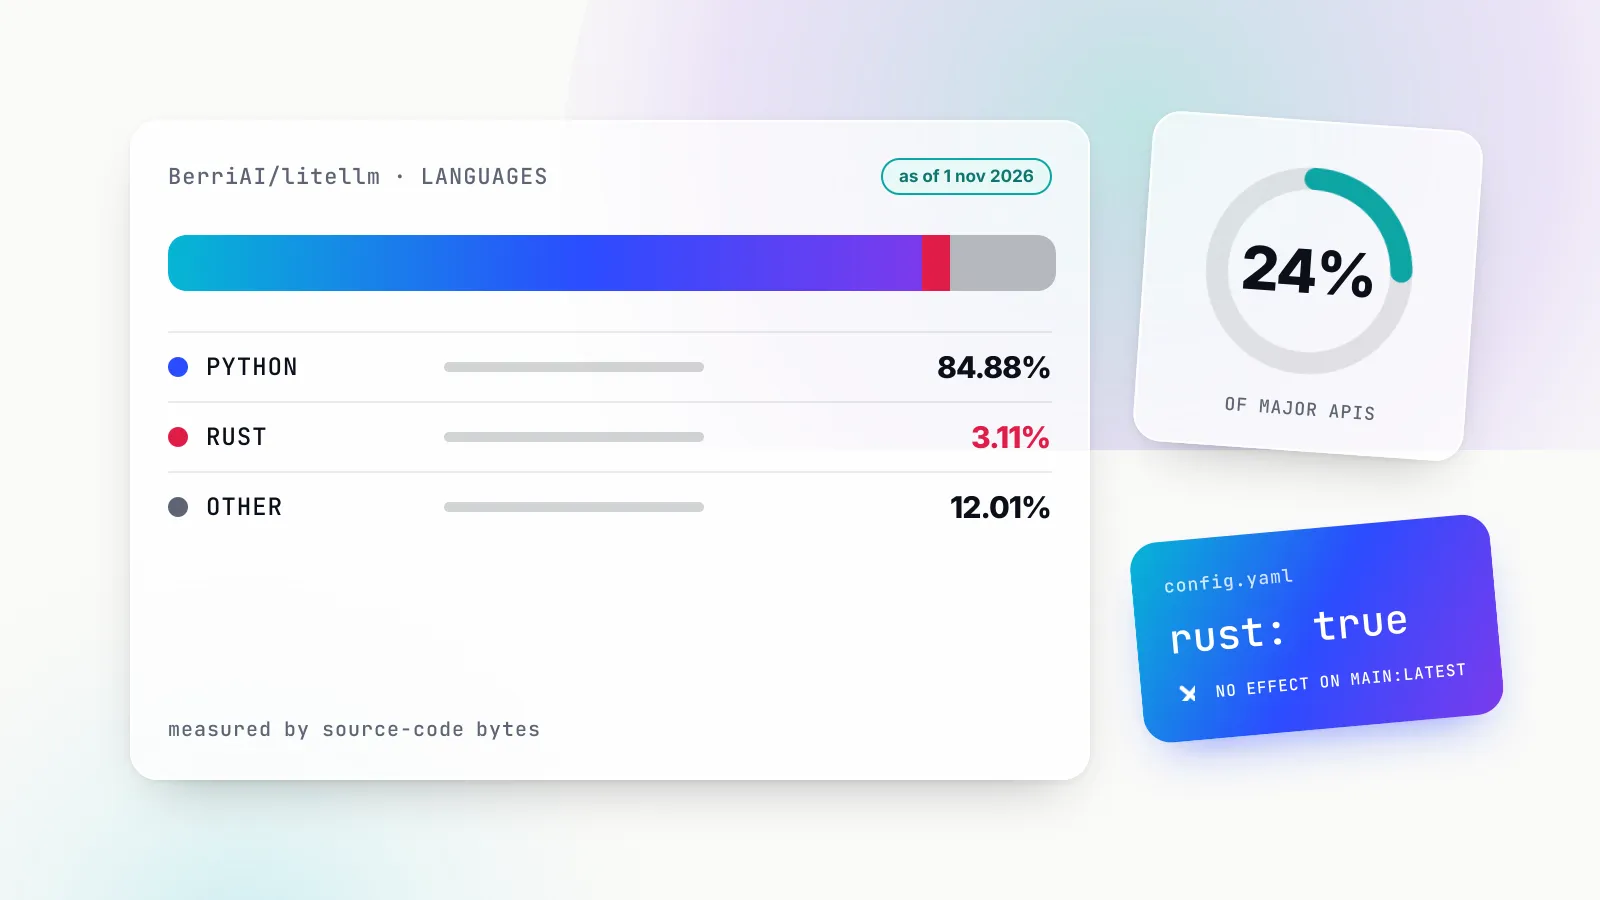
That gap matters because the Rust numbers are the ones on the homepage, and they do not describe the LiteLLM proxy a team deploys today. As of November 1, 2026, LiteLLM’s documentation states that Chat Completions and Messages in main:latest still run on Python, and that the per-model rust: true flag has no effect. A team that upgrades and expects the Rust column will get the Python column for its chat traffic.
This comparison puts the three columns side by side, explains what each metric measures, and sets out what the data does and does not tell a team running LiteLLM in production. Every figure comes from LiteLLM’s published files, checked as of November 1, 2026. Where those files favour Rust, this article says so.
Cross-check of the published resource files
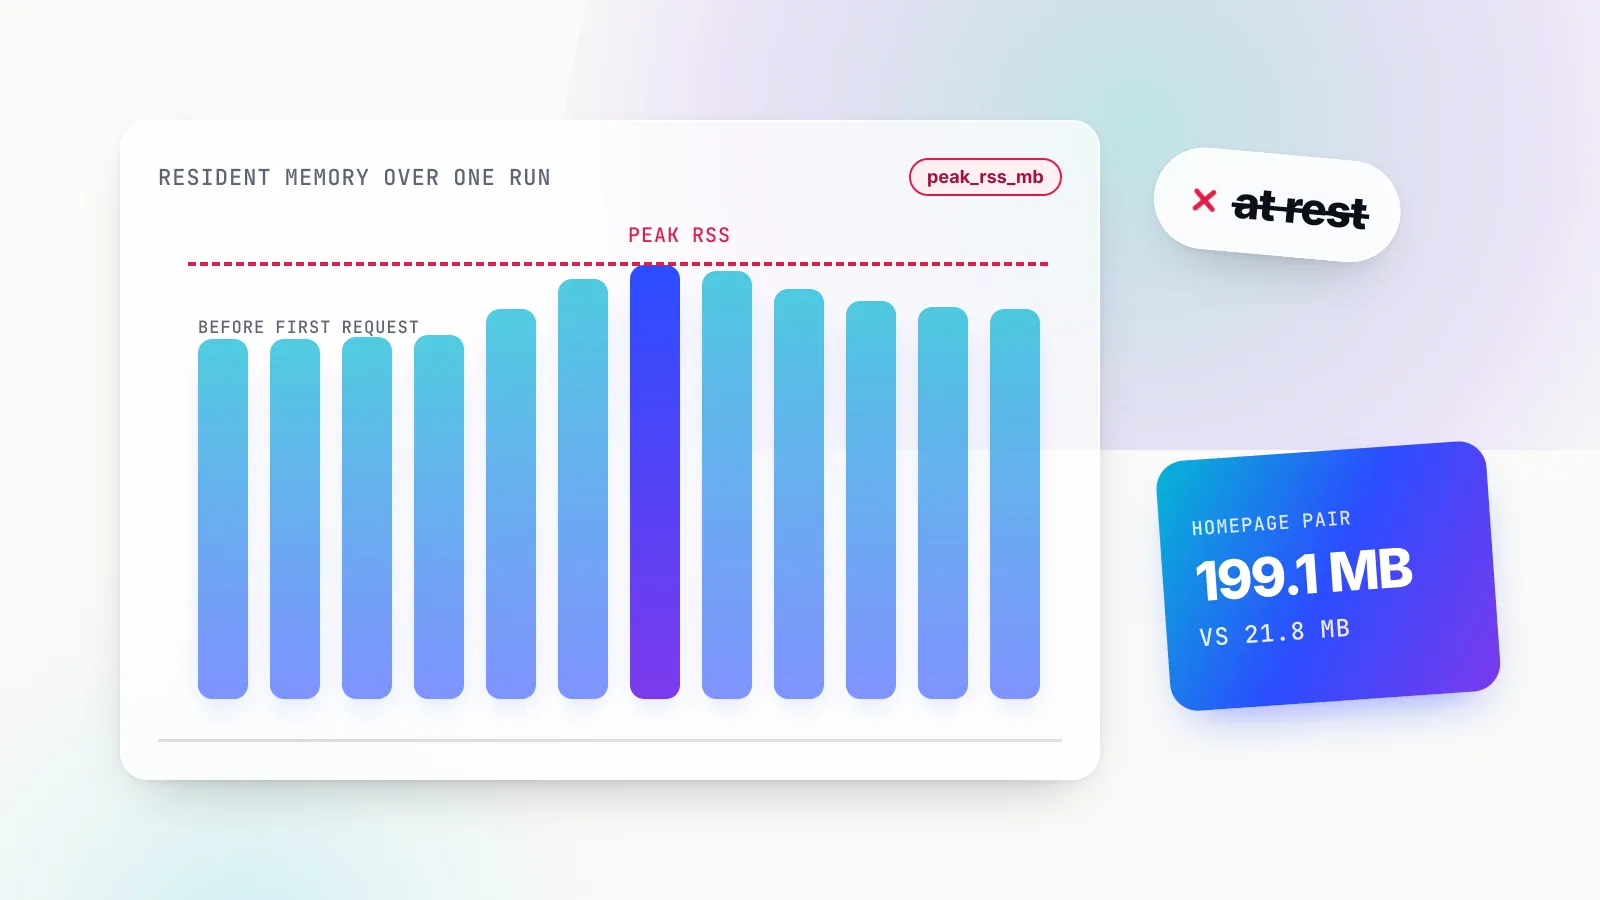
LiteLLM Rust recorded lower peak RSS in three of four published file sets; Bifrost was lower in the ceiling run at 242.6 MB versus 297.1 MB for Rust. The ceiling results report 0.242614272 GB for Bifrost and 0.29710336 GB for Rust, converted here to decimal MB. The other three sets favor Rust: 21.8 MB versus 199.1 MB in the messages/release capture; 26.1 MB versus about 144 MB in the earlier memory capture; and roughly 35–36 MB versus 282–298 MB in the CPU time series. These are different measurements, not repeated trials of one identical setup.
The ceiling file also records Rust at 21.075% average CPU and 2,814.35 RPS. The separate CPU time series records a much lower average over its own sampling window. The figures must retain their file and workload context.
The Bifrost post identifies v1.6.4 as the tested build and infers default-on logging from v2.4.0 code; it explicitly says that behavior was not yet confirmed on v1.6.4. Neither the blog nor the benchmark files quantify logging’s share of the memory or CPU difference.
The three gateways in LiteLLM’s sweep
LiteLLM’s benchmark repository times three gateways against a direct call: its Python proxy, its Rust beta, and Bifrost v1.6.4. The three differ in language, maturity and how they were configured, so before comparing numbers it helps to be clear about what each column actually represents.
| Gateway | What it is | Version in the benchmark | Configuration in the benchmark | Serves chat in main:latest? |
|---|---|---|---|---|
| LiteLLM Python proxy | LiteLLM’s existing proxy, the documented Python path for chat routes at the source check date | “LiteLLM Python v1”; no exact release named | Blog says no logging callbacks, spend tracking or persistence | Yes |
| LiteLLM Rust beta | A partial Rust port of the gateway’s request path | “LiteLLM Rust beta”; streaming not yet available | Blog says no logging callbacks, spend tracking or persistence | No, only /ocr and Bedrock /audio/transcriptions |
| Bifrost | An open-source AI gateway written in Go, built by Maxim AI | v1.6.4, an older build | Published config never sets enable_logging; logging appears to have been on | Not applicable |
The version and configuration columns come from LiteLLM’s benchmark blog post, which lists “LiteLLM Rust beta, LiteLLM Python v1, Bifrost v1.6.4”, and from the Bifrost gateway README in the benchmark repo. The blog names no Python v1 version and no hardware.
The one-line criterion for reading the rest of this article is simple. For a team on LiteLLM, the relevant column is the one that matches the code path its requests take. For chat traffic in main:latest, that is the Python column.
How a concurrency sweep measures an LLM proxy
Latency is the time one request takes from send to response. Throughput is the number of requests a system completes per second. A concurrency sweep holds a fixed number of requests in flight, steps that number up, and records both at every level, which shows where a gateway stops adding capacity and starts adding delay.
The two metrics are linked through concurrency, a relationship the site’s explainer on throughput vs latency covers in depth. When a gateway has spare capacity, doubling the number of in-flight requests roughly doubles the requests completed per second, and each request takes about as long as before. When the gateway reaches its limit, extra requests cannot be processed any faster. They wait. Throughput flattens, and the waiting shows up as latency, first in the slowest requests and then across the distribution.
That is why a sweep is more informative than a single number. A gateway that looks fast at one request at a time may saturate at 16, and a single overhead figure taken at low concurrency says nothing about where that happens. A sweep shows the shape of the curve.
What “added p99” means in this benchmark
LiteLLM’s benchmark reports overhead as added latency. Its blog defines overhead as gateway latency minus direct-to-mock latency, and charts it as p99 added latency. The setup has three parts:
- A load driver that sends requests at a fixed concurrency: 1, 4, 16 or 64 requests in flight.
- A simulated upstream that stands in for a model provider, so provider variance does not enter the measurement. The same mock is used for every gateway.
- A direct baseline, where the load driver calls the simulated upstream with no gateway in between.
Each gateway’s p99 is compared with the direct p99 at the same concurrency. The difference is the gateway’s added p99: the extra time the slowest 1% of requests spent because the gateway was in the path. In the sweep, the direct p99 is 21.98 ms at concurrency 1, 22.42 ms at 4, 22.67 ms at 16 and 24.02 ms at 64.
p99 is the right percentile for this purpose because gateways rarely slow every request evenly. Queueing, garbage collection and contention tend to hit a minority of requests hard, and the tail is where users notice. The site’s explainer on how an AI gateway handles a request covers the stages that can add that time.
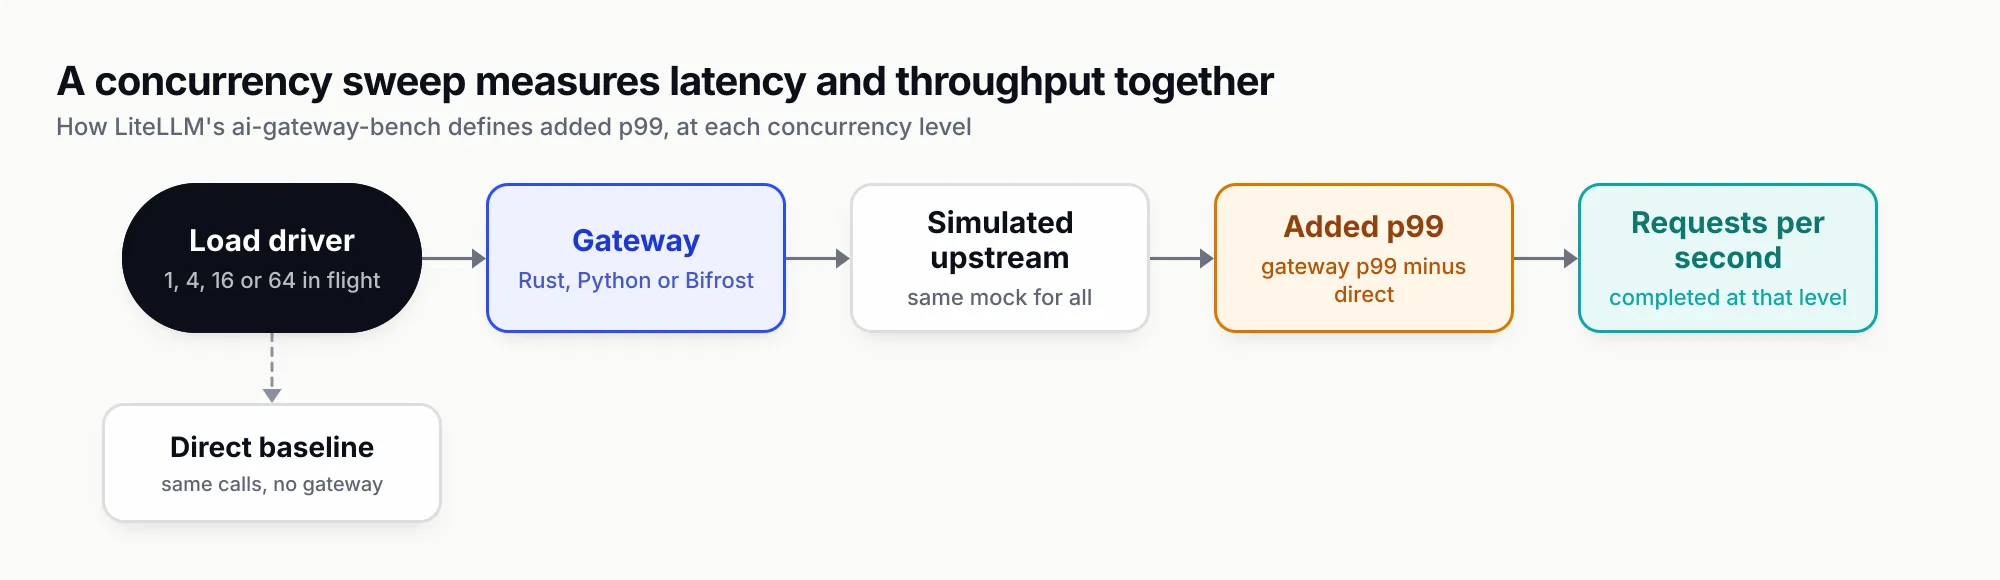
Figure 1: A concurrency sweep measures latency and throughput together, against a direct baseline, at each level of in-flight requests.
LiteLLM Rust vs Python vs Bifrost, side by side
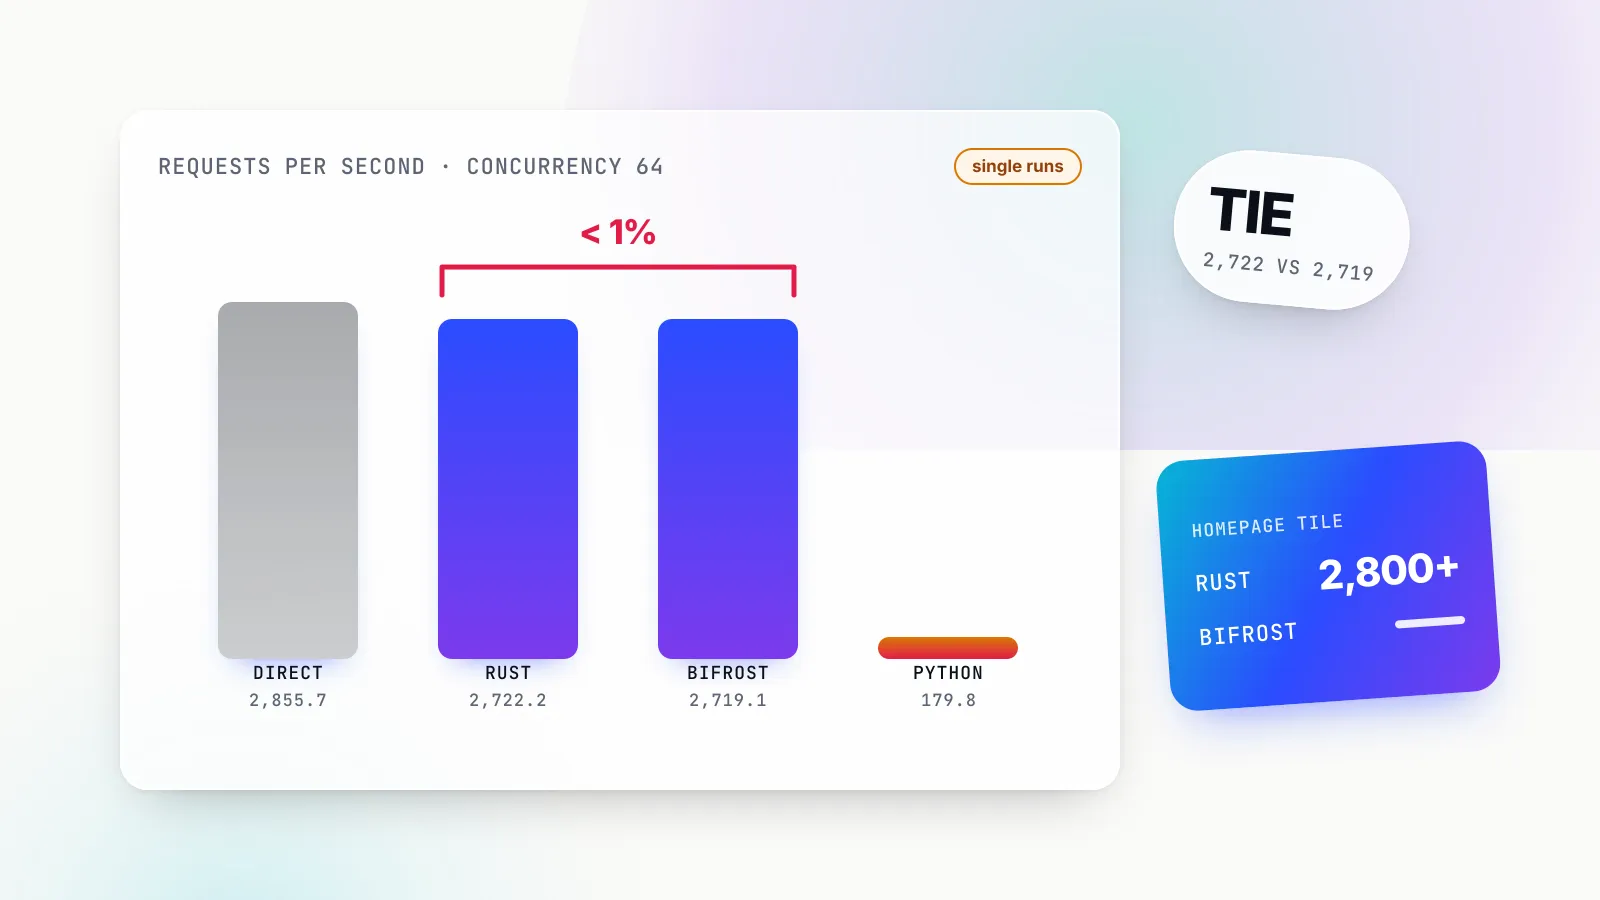
The three-way table below summarizes selected published figures for the three gateways. Up to concurrency 16, the Rust beta and Bifrost each add under a millisecond of p99, while the Python proxy adds from 9.79 ms to 251.34 ms. At concurrency 64, Python adds 546.04 ms and serves 179.8 requests per second.
The latency and throughput rows come from latency_vs_concurrency.csv in LiteLLM’s benchmark repo. All error counts in the file are zero. The CPU and memory rows come from other files in the results directory; no Python figures for those two are published alongside the Rust and Bifrost ones, so those cells say so rather than leaving a blank.
| Metric (as of November 1, 2026) | LiteLLM Rust beta | Bifrost v1.6.4 | LiteLLM Python proxy |
|---|---|---|---|
| Added p99, concurrency 1 | +0.89 ms | +0.75 ms | +9.79 ms |
| Added p99, concurrency 4 | +0.61 ms | +0.63 ms | +26.95 ms |
| Added p99, concurrency 16 | +0.33 ms | +0.89 ms | +251.34 ms |
| Added p99, concurrency 64 | +40.28 ms | +28.68 ms | +546.04 ms |
| Throughput, concurrency 64 (direct 2,855.7) | 2,722.2 RPS | 2,719.1 RPS | 179.8 RPS |
| Share of direct throughput, concurrency 64 | 95.3% | 95.2% | 6% |
| CPU, mean (peak) | 0.66% (15.9%) | 2.59% (79.5%) | Not published |
| Peak RSS, four file sets | Lower in three captures; 297.1 MB in ceiling run | 242.6 MB in ceiling run; higher in three other captures | Not stated here |
| Concurrency 256, p50 / p99 (exploratory, one run) | 55.5 / 2,667.8 ms | 89.3 / 5,421.3 ms | 1,513 / 10,733.6 ms |
The full throughput sweep adds the lower concurrency levels:
| Concurrency | Direct (RPS) | LiteLLM Rust beta | Bifrost v1.6.4 | LiteLLM Python proxy |
|---|---|---|---|---|
| 1 | 46.2 | 45.2 | 44.8 | 34.4 |
| 4 | 184.5 | 181.2 | 180.2 | 92.7 |
| 16 | 735.6 | 721.8 | 722.7 | 158.4 |
| 64 | 2,855.7 | 2,722.2 | 2,719.1 | 179.8 |
Three caveats travel with these tables. Each cell appears to be a single run, with no repeated trials or error bars. The concurrency 256 row comes from JSON files that the repo excluded from the sweep, with no RPS field, which makes it an exploratory result rather than a reliable capacity comparison. And the gateways were not configured identically, which the section on the limits of the evidence covers in detail.
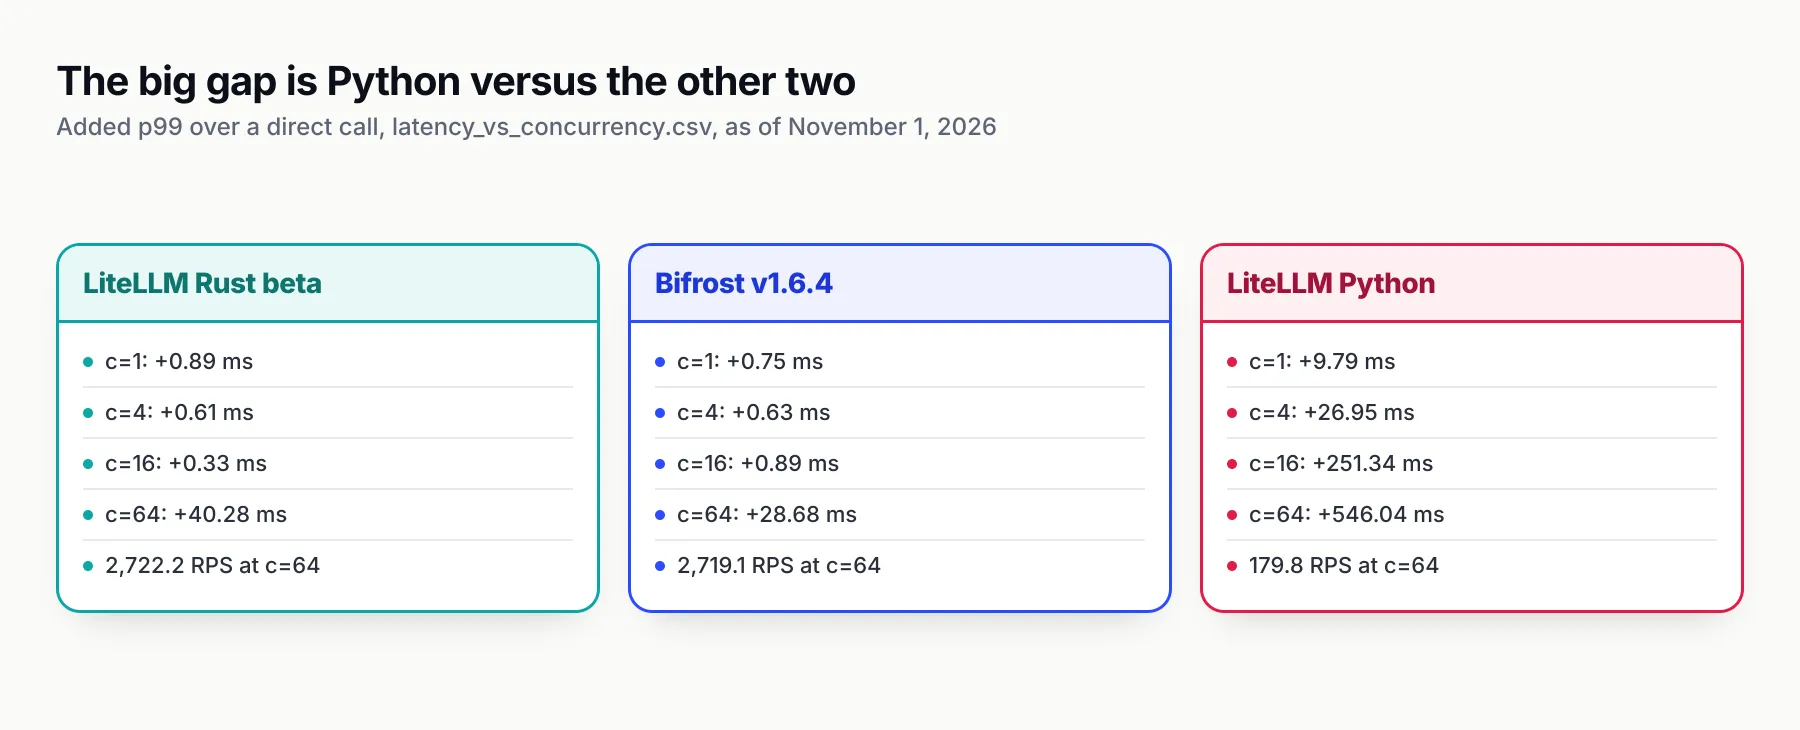
Figure 2: On added p99, the large gap in LiteLLM’s sweep is between the Python proxy and the other two, not between Rust and Bifrost.
How the LiteLLM Python proxy behaves as concurrency rises
The Python proxy’s added p99 rises at every step of the sweep: 9.79 ms at concurrency 1, 26.95 ms at 4, 251.34 ms at 16 and 546.04 ms at 64. Its throughput rises much less: 34.4, 92.7, 158.4 and 179.8 requests per second. At 64 it reaches 6% of direct throughput.
Read as a curve of latency against throughput, the Python column has a recognisable shape.
At concurrency 1, the proxy adds 9.79 ms on a direct p99 of 21.98 ms, and its throughput is 34.4 requests per second against 46.2 direct. One request at a time, the proxy is slower than the other two gateways, but it is not saturated.
From concurrency 4 to 16, the direct baseline’s throughput rises from 184.5 to 735.6 requests per second. The Python proxy’s rises from 92.7 to 158.4, while its added p99 climbs from 26.95 ms to 251.34 ms. Throughput is no longer keeping pace with concurrency, and latency is taking up the difference.
From concurrency 16 to 64, the direct baseline’s throughput rises from 735.6 to 2,855.7. The Python proxy’s rises from 158.4 to 179.8, and its added p99 goes from 251.34 ms to 546.04 ms. In the terms of the previous section, this is a gateway past saturation: additional in-flight requests do not complete faster, they wait.
The exploratory concurrency 256 run continues the pattern. The Python proxy records a p50 of 1,513 ms and a p99 of 10,733.6 ms, against a direct p50 of 48.1 ms and p99 of 434.8 ms. In that single run, Bifrost is about 17x better than LiteLLM Python at p50 and 2x better at p99. Because the direct baseline itself was already outside the benchmark’s latency threshold at 256, the run is evidence of direction, not a capacity figure.
What the files do not say about the Python numbers
The sweep records the effect, not the cause. LiteLLM’s benchmark states no machine type, core count or worker count for any gateway. That matters most for the Python column, because a Python service’s behaviour under concurrency depends heavily on how many processes serve it and how much CPU each one has. The files do not say how the Python proxy was deployed, so its 179.8 requests per second cannot be tied to a specific worker configuration.
The blog also does not name the Python release it tested. “LiteLLM Python v1” covers many versions. A team that wants to compare its own proxy with this column cannot match the version exactly.
None of this makes the Python figures wrong. They are LiteLLM’s own measurements of its own proxy, published next to its Rust results. It does mean the Python column describes one unstated deployment, on unstated hardware, with logging and spend tracking off, and a team’s own figures could be better or worse depending on how its deployment differs.
The 13.6x figure in context
The concurrency 64 row fits in one sentence: LiteLLM Python adds 546 ms, about 13.6x the Rust port, and reaches 180 requests per second, 6% of direct. That ratio is the clearest single statement of the gap between the proxy LiteLLM users run and the beta LiteLLM benchmarks.
It is also a statement about the same vendor’s two products, measured by that vendor on one host. The Rust beta and the Python proxy shared a load driver, a simulated upstream and a benchmark configuration. Whatever the limits of the method, the gap between those two columns is not a cross-vendor configuration artefact.
Where the Rust beta and Bifrost sit relative to each other
LiteLLM’s Rust beta and Bifrost are close at every measured level of the sweep. Rust adds less p99 at concurrency 16, the two are tied at 4, and Bifrost adds less at 1 and 64. Every throughput gap between them is under 1%. Outside the sweep, Rust records lower CPU in the sampled CPU files and lower peak RSS in three of four file sets and leads at concurrency 256.
On added p99, the cells split. At concurrency 1, Bifrost adds +0.75 ms against Rust’s +0.89 ms. At 4, the gap is 0.02 ms (+0.63 against +0.61), whose significance is unknown without repeated trials. At 16, Rust is lower: +0.33 ms against +0.89 ms, a 0.56 ms difference that is 2.7x the added latency but about 2.4% of total p99. At 64, Bifrost adds +28.68 ms against Rust’s +40.28 ms, about 29% less.
On throughput, the gaps are smaller still: 44.8 against 45.2 requests per second at concurrency 1, 180.2 against 181.2 at 4, and 2,719.1 against 2,722.2 at 64, where Bifrost keeps 95.2% of direct throughput and Rust 95.3%. With one run per cell and no confidence intervals, the significance of these gaps is unknown. The reported throughput is similar for the Rust beta and Bifrost; these single runs do not establish a consistent performance winner.
Where Rust leads
Three results go to Rust, and they belong in any honest comparison.
- CPU. Bifrost averages 2.59% with a peak of 79.5%, against Rust’s 0.66% with a peak of 15.9%, in cpu_bifrost.csv and cpu_rust.csv. These are whole-process measurements under the configurations described below.
- Memory. Rust records lower peak RSS in three of four published file sets. The ceiling file instead records Rust at 297.1 MB and Bifrost at 242.6 MB. The site’s article on what LiteLLM’s memory figure actually measures covers the three non-ceiling pairs in detail; the homepage’s “memory at rest” label on the widest pair is mislabelled peak RSS.
- Concurrency 256. Rust records a p50 of 55.5 ms and a p99 of 2,667.8 ms, against Bifrost’s 89.3 ms and 5,421.3 ms. That is one run of 5,000 requests per gateway, with no errors and no RPS field, excluded from the sweep because the direct baseline already exceeded the benchmark’s latency threshold.
These leads describe the tested configurations. They do not establish an equivalent-feature performance advantage, because the two gateways were not doing the same work.
Why this pair matters less to a LiteLLM team than the Python column
For a team choosing a new gateway, the Rust and Bifrost columns are the interesting comparison. For a team already running LiteLLM, they are mostly beside the point. The Rust beta is not what serves its chat requests, and the gap between Rust and Bifrost is a fraction of a millisecond at most levels. The gap between either of them and the Python proxy is hundreds of milliseconds at concurrency 16 and above.
Which LiteLLM code path chat traffic takes in main:latest
In main:latest, LiteLLM’s Python proxy serves only /ocr for every provider and /audio/transcriptions for Bedrock through Rust. Every other route, including Chat Completions and Messages, runs on Python. The per-model rust: true flag currently has no effect, according to the warning at the top of LiteLLM’s Rust gateway documentation.
The Rust gateway documentation states this directly, and it is the single most important fact for interpreting the sweep. The same page retains older coverage descriptions beneath the warning, so deployment claims need a specific version. A reader who skims past the warning to the coverage lists can come away believing more routes are on Rust than the build delivers.
The migration tracker tells the same story from the engineering side. It reports 24% of Major APIs built as of v1.107.0-rc.2, which is 35.4 of 146 weighted engineering points, and lists router migration, database access, budgets and rate limits, and database-backed configuration at 0%. While Rust coverage develops, the existing Python proxy still owns authentication, routing, logging, callbacks and spend tracking. The site’s explainer on whether LiteLLM is written in Rust goes through the language breakdown, the route list and the tracker in full.
Put together, a Chat Completions request in main:latest follows a path that the Rust column of the sweep never measured. It enters the Python proxy, is authenticated, routed and logged in Python, and is sent to the provider by Python. Setting rust: true on the model does not change that.
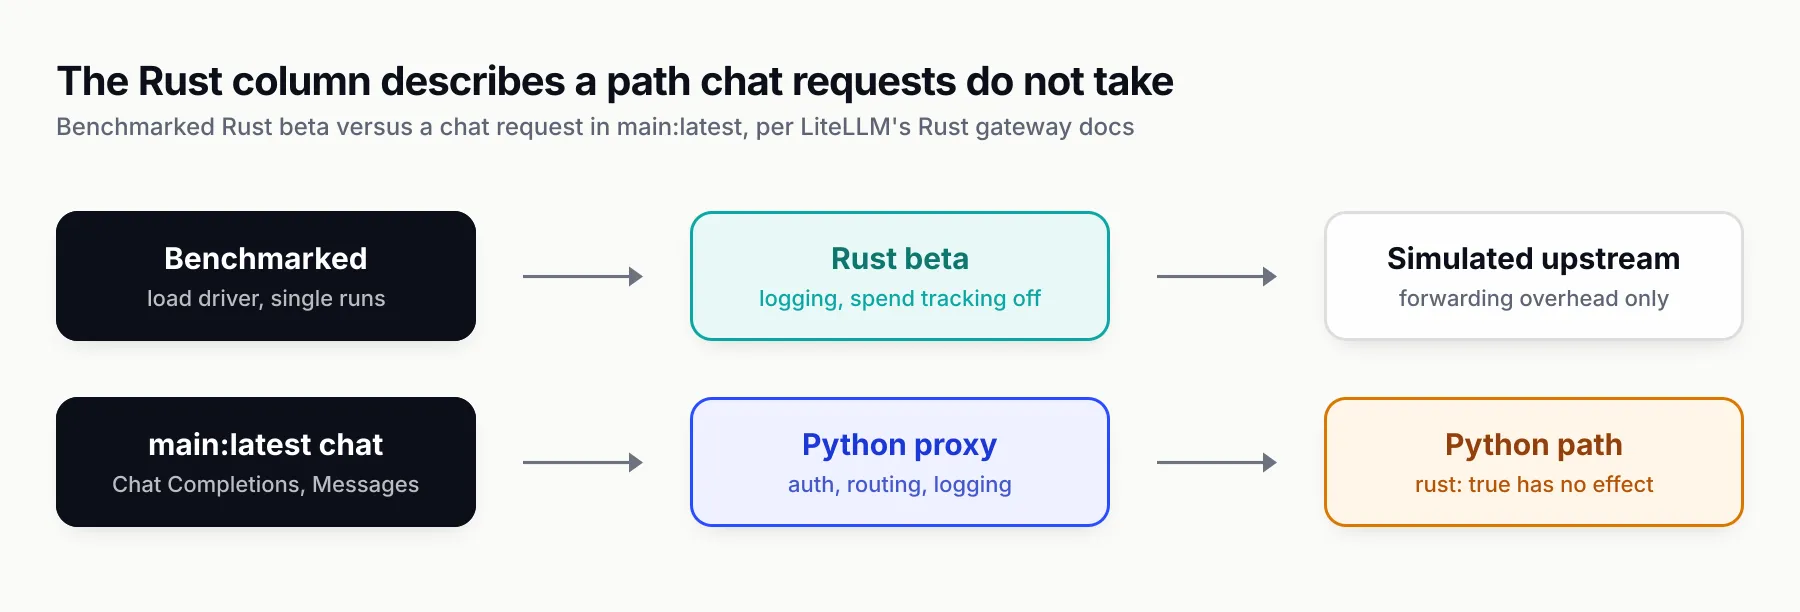
Figure 3: The Rust column describes a path that chat requests in main:latest do not take.
What upgrading LiteLLM changes, and what it does not
Upgrading to main:latest does not move Chat Completions or Messages onto Rust, as of November 1, 2026. The routes that run on Rust are /ocr and Bedrock /audio/transcriptions. For chat traffic, the benchmark’s Rust figures describe a beta path that chat requests in the current build do not take.
Three distinctions keep the answer accurate.
Upgrading is not migrating. Pulling a newer LiteLLM release changes the Python proxy, and a given release may or may not change its performance. The sweep says nothing about that, because the blog does not name the Python release it tested. What an upgrade does not do, in the current build, is put chat traffic on the Rust path.
The flag is not a switch. The per-model rust: true setting exists in LiteLLM’s configuration. In main:latest, it does nothing. Teams that set it on chat models are running those models on Python, and should not attribute any latency change after an upgrade to Rust.
The Rust beta is not the product. LiteLLM’s blog describes the Rust gateway as an early beta in which “streaming and the full feature surface are still landing”, and says of its own benchmark: “It is not a full-feature comparison.” The router, budgets, rate limits and database access, all at 0% on the tracker, sit outside what the Rust column measured.
None of this predicts what LiteLLM will ship. The route list in the Rust gateway warning is the thing to watch. When Chat Completions or Messages appear on it for a named release, teams can test that release’s end-to-end path. Earlier beta results do not automatically transfer to it.
Limits of the evidence
The sweep is LiteLLM’s own data, which makes it useful, but it has gaps that apply to all three columns. The runs are single, with no error bars and no stated hardware or worker counts. Bifrost appears to have run with logging on while LiteLLM’s gateways ran with it off. And the Bifrost build is old.
Each limit changes how much weight a particular cell can bear.
Single runs, no error bars, no hardware
LiteLLM’s blog describes “single-host, per-scenario runs (for example n=5000 on the overhead panel) without repeated-trial error bars” and asks readers to “treat them as order-of-magnitude differences”. No machine type, core count or worker count is given for any gateway. The only hardware in LiteLLM’s materials is a 4 vCPU, 16 GB instance, and it appears in the cost model, not the benchmark runs. The site’s article on LiteLLM’s requests-per-dollar model covers that model.
Single runs matter most for small gaps, and two of LiteLLM’s own files show how unstable they are at concurrency 64: total p99 for Bifrost is 52.7 ms in the sweep and 32.2 ms in rps_per_dollar.csv, and for Rust 64.3 ms and 26.9 ms. The ranking flips between LiteLLM’s own files. Differences of a fraction of a millisecond between Rust and Bifrost cannot be read as a ranking.
The Python gap is of a different size. Hundreds of milliseconds of added p99 at concurrency 16 and 64 is far larger than those file-to-file differences, although the absence of repeated trials still means the exact figures could move.
A configuration that was not like-for-like
LiteLLM’s blog says every gateway ran “with no logging callbacks, spend tracking, or persistence enabled”. The published Bifrost config sets a simulated upstream, config_store: enabled: false and no plugins, but never sets enable_logging or logs_store. In Bifrost, enable_logging is the master toggle for request tracing, as the built-in observability documentation describes. It defaults to true when unset and creates a default SQLite log store, so, if that inference holds for v1.6.4, Bifrost’s results include log buffering and SQLite writes.
That finding carries a hedge: it is inferred from v2.4.0 code and not yet confirmed on v1.6.4. The LiteLLM Rust config has not been checked in the same way. If the inference holds, Bifrost was doing more work per request than the two LiteLLM gateways, which bears on the Rust and Bifrost comparison and on the CPU and memory findings. It does not bear on the Python column, which by the blog’s account ran with the same features off as the Rust beta.
An old Bifrost build, called on its native route
The Bifrost build tested was v1.6.4. Its changelogs list v1.6.5 to v1.6.11, then v2.0.0 to v2.4.0, and the 2.x line has since reduced memory use. No figure for that reduction has been published, and this article gives none. The gateway was also called on its native /anthropic/v1/messages route, because the benchmark’s Bifrost README says v1.6.4 does not mount that integration at /v1/messages.
What the sweep cannot tell a LiteLLM team
The benchmark measured forwarding overhead with governance features off. A production LiteLLM deployment typically does more on each request: it checks keys, applies budgets and rate limits, routes between deployments and records spend. None of that work is in the Python column either, so a governed deployment does more work on each request than the benchmarked one. The site’s editorial on vendor benchmarks and their footnotes covers why these disclosures decide how far a published number travels.
What the data means for teams running LiteLLM today
For a team on LiteLLM, the Python column is the closest published description of its chat traffic’s overhead, and the size of that overhead depends on concurrency. At one to four requests in flight it is tens of milliseconds at p99; at 16 and above it is hundreds. The Rust figures describe a future path, not the current one.
How much that matters depends on the workload. Four situations cover most teams.
A low-concurrency internal tool
A team runs an internal assistant with a handful of users, so the proxy rarely holds more than a few requests at once. In the sweep, the Python proxy adds 9.79 ms of p99 at concurrency 1 and 26.95 ms at 4. Against model responses that take seconds to stream, that overhead is small. For this team, the Rust and Python gap in LiteLLM’s benchmark is real but unlikely to be the constraint, and there is no urgency in the data to change anything.
A product with bursty user traffic
A customer-facing product sees peaks where dozens of requests are in flight. The sweep shows the Python proxy adding 251.34 ms of p99 at concurrency 16 and 546.04 ms at 64, with throughput flattening at 158.4 and 179.8 requests per second. If the team’s peak sits in that range, the proxy’s tail latency is a plausible contributor to slow responses at the worst moments. The first step is to measure its own deployment at its own peak concurrency, because worker count and hardware were not disclosed in the benchmark and may differ.
An agent or batch workload that fans out
Agent frameworks and batch jobs often issue many model calls in parallel, which pushes concurrency up quickly. A workload that holds 64 calls in flight is exactly where the sweep shows the Python proxy at 6% of direct throughput. For this team, throughput is the binding constraint, and capacity planning based on the Rust column would overestimate, by a wide margin, what the Python proxy delivered in LiteLLM’s own test.
A team waiting for the Rust migration
Some teams will decide to stay on LiteLLM and wait for Rust to reach chat routes. That is a reasonable plan if the current overhead is acceptable. The signals to track are specific: the route list in the Rust gateway warning, and the router, budgets, rate limits and database rows on the migration tracker, all at 0% as of November 1, 2026. Until chat routes and those components move, a governed chat request depends on Python.
A team weighing a different gateway
Other teams will treat the sweep as a reason to evaluate alternatives. The site’s guide to LiteLLM alternatives covers the wider field. Bifrost is the third column in LiteLLM’s own benchmark, and its documentation describes a LiteLLM SDK integration at a /litellm endpoint: applications that call LiteLLM’s SDK can point base_url at Bifrost, with a documented caveat that requests to providers only one of the two supports will fail.
Test the release and configuration that would be deployed, and apply the same criteria to every candidate.
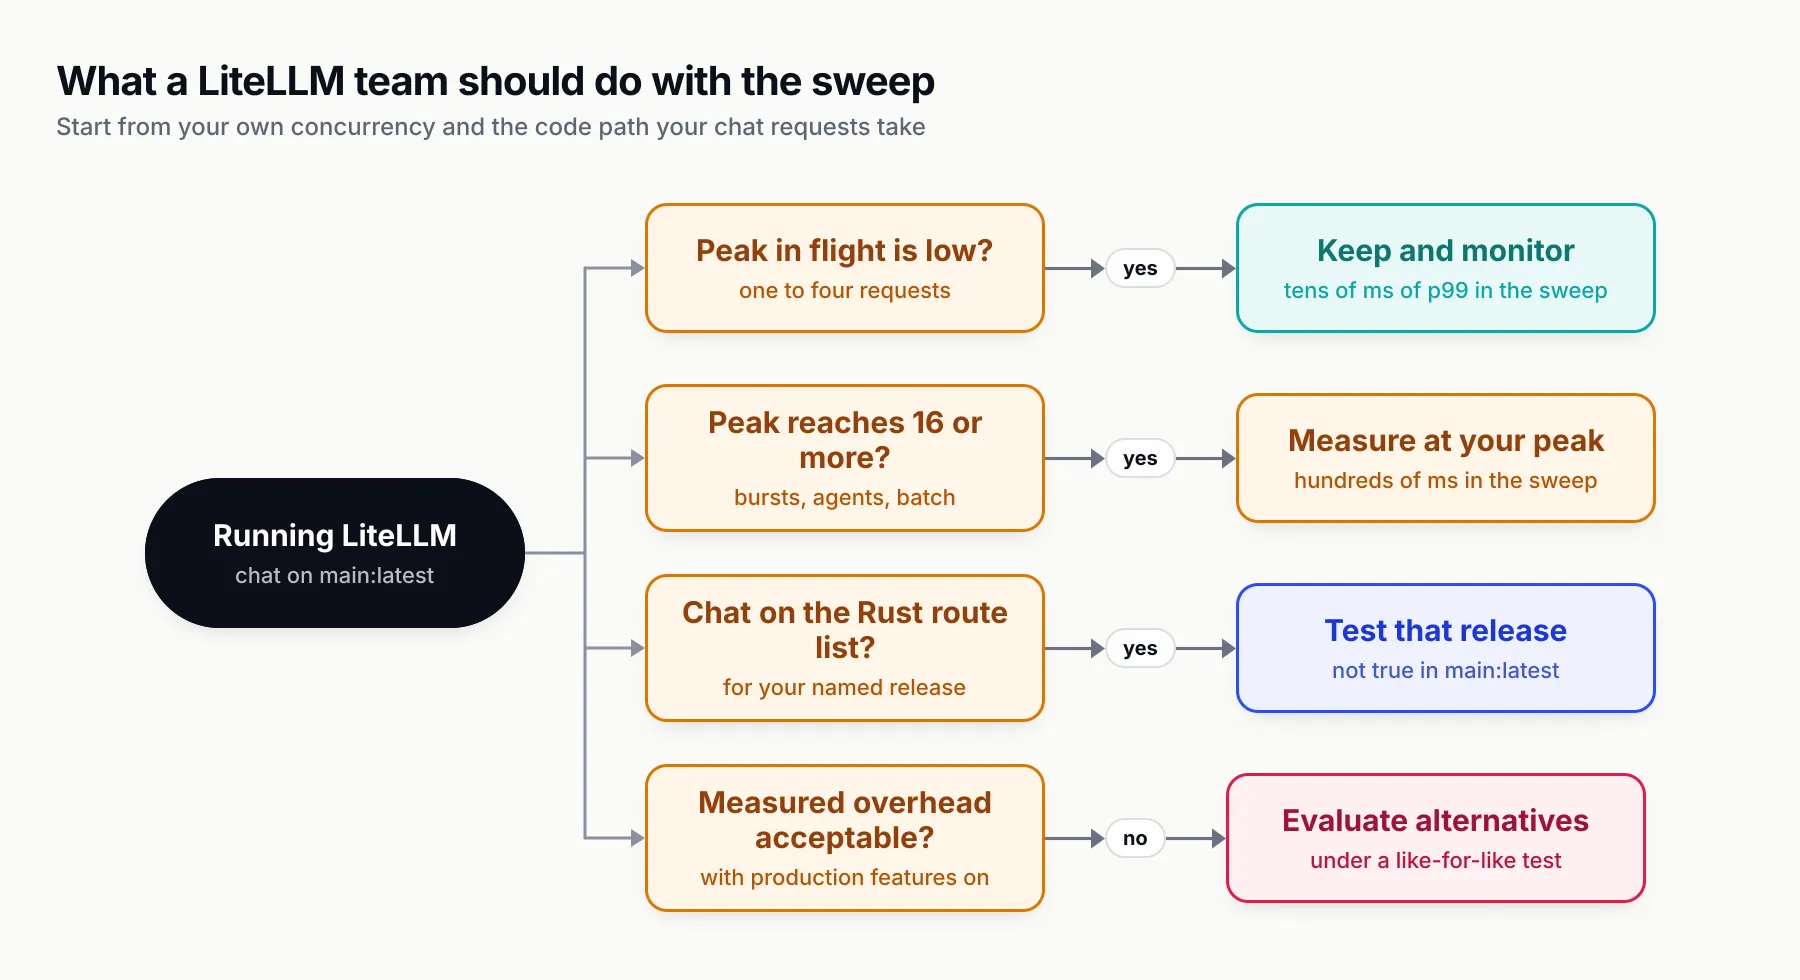
Figure 4: The right response to the sweep depends on a team’s own concurrency and on which code path its chat requests take.
How to measure your own LiteLLM proxy’s latency and throughput
The way to answer “is our LiteLLM proxy slow” is to run a smaller version of the same sweep against the deployment in production. Use a simulated upstream, a direct baseline, a range of concurrency levels and repeated runs, and record the release, workers, hardware and enabled features alongside every result.
LiteLLM’s benchmark, and the gaps in it, between them describe what a credible measurement needs. The checklist below follows both.
- Use a simulated upstream. Point the proxy at a mock provider with a fixed response delay, so the measurement isolates the gateway. Any HTTP mock that can return a fixed OpenAI-compatible response works. Bifrost’s benchmarking documentation describes an open-source mock server and load generator built for this purpose, which can target other gateways as well.
- Measure the direct baseline. Call the mock directly at every concurrency level. Added latency is only meaningful against that baseline, as LiteLLM’s own definition of overhead shows.
- Sweep concurrency past your peak. Run at 1, 4, 16 and 64 at least, and beyond the highest concurrency the deployment sees in production. The point where throughput stops rising is the number that matters for capacity planning.
- Record p50, p99 and requests per second at each level. p50 shows typical overhead, p99 shows the tail, and throughput shows saturation. The sweep file in LiteLLM’s repo has only p99; the per-run JSON files also carry p50.
- Repeat every level. Run each concurrency level several times and report the spread. Single runs are the main reason small gaps in LiteLLM’s sweep cannot be ranked.
- Write down the deployment. Record the LiteLLM release, the number of workers, the CPU and memory available, and the host type. These are the fields missing from LiteLLM’s benchmark, and without them nobody can compare results.
- Test with production features on and off. Run once with logging, callbacks, budgets and spend tracking configured as in production, and once with them off. The difference is the cost of the features, and the “on” run is the one that describes reality.
- Name the route. Test Chat Completions or Messages if that is the traffic. In
main:latest, those routes run on Python whatever the configuration flags say.
A team that runs this once has a better answer to its own LiteLLM proxy performance question than any vendor chart can give it, whichever vendor published it.
Reading the result
If the deployment’s added p99 at its real peak is a few milliseconds and throughput tracks the direct baseline, the proxy is not the bottleneck and the benchmark controversy has little practical bearing. If added p99 climbs into the hundreds of milliseconds and throughput flattens well below the baseline, as in LiteLLM’s sweep for its Python proxy, the team has a measured reason to act: add capacity, reconfigure workers, wait for Rust on chat routes, or evaluate another gateway under the same test.
Reading the three columns
LiteLLM’s sweep answers a narrower question than its homepage suggests. It shows a Rust beta and Bifrost close together on forwarding overhead, with Rust ahead on CPU and memory, and a Python proxy that saturates well before either. For teams running LiteLLM today, the Python proxy is the column that describes their chat traffic, as of November 1, 2026.
That leads to a plain judgement. The headline Rust figures are a statement about where LiteLLM’s engineering is going, not about the proxy in production. The figure that should concern current LiteLLM operators is not 7x or 9x but 546.04 ms of added p99 at concurrency 64 and 179.8 requests per second, from LiteLLM’s own file, on a code path that main:latest still uses for Chat Completions and Messages.
We think the right response is measurement rather than reaction. A team that knows its peak concurrency, sweeps its own proxy at that level and records the conditions will know whether the curve in LiteLLM’s benchmark applies to its LiteLLM proxy. A like-for-like rerun of both gateways, with logging off and on, a current Bifrost build, repeated trials, error bars and published hardware, would settle the open questions between Rust and Bifrost. Until LiteLLM’s route list includes chat, or until such a rerun is published, teams should measure the Python path their release actually serves, rather than size production directly from either benchmark column.
Source: Debunking LiteLLM Rust Benchmarking: Part 1, by Akshay Deo of Maxim AI, which builds the Bifrost gateway.
Sources
- Throughput ceiling results: memory, CPU and sustained RPS
- Debunking LiteLLM Rust Benchmarking: Part 1 Maxim AI (Akshay Deo)
- latency_vs_concurrency.csv BerriAI on GitHub
- ai-gateway-bench results directory BerriAI on GitHub
- Benchmarking the LiteLLM Rust AI Gateway BerriAI
- [Beta] Rust AI Gateway BerriAI
- LiteLLM Rust migration tracker BerriAI
- LiteLLM homepage benchmark section BerriAI
- cpu_bifrost.csv BerriAI on GitHub
- cpu_rust.csv BerriAI on GitHub
- rps_per_dollar.csv BerriAI on GitHub
- ai-gateway-bench Bifrost gateway README BerriAI on GitHub
- Bifrost built-in observability Maxim AI
- Bifrost LiteLLM SDK integration Maxim AI
- Run your own Bifrost benchmarks Maxim AI
Frequently asked questions
Will upgrading LiteLLM make my proxy faster?
Not through Rust, for chat traffic, as of November 1, 2026. LiteLLM's Rust gateway documentation says that in main:latest only /ocr and Bedrock /audio/transcriptions run on Rust; Chat Completions and Messages run on Python and the per-model rust true flag has no effect. The fast Rust figures in LiteLLM's benchmark describe a beta path that chat requests do not take.
How much latency does the LiteLLM Python proxy add?
In LiteLLM's own concurrency sweep, the Python proxy adds 9.79 ms of p99 latency at concurrency 1, 26.95 ms at 4, 251.34 ms at 16 and 546.04 ms at 64, over a direct call of about 22 to 24 ms. The runs used a simulated upstream with logging callbacks, spend tracking and persistence off, single runs per cell.
Why is LiteLLM slow under high concurrency?
The published files show the effect but not the cause. Added p99 for the Python proxy climbs from 251.34 ms at concurrency 16 to 546.04 ms at 64 while throughput rises only from 158.4 to 179.8 requests per second. LiteLLM's benchmark gives no worker, core or hardware counts, so the figures cannot be tied to a particular deployment shape.
Does LiteLLM's Rust benchmark reflect the LiteLLM proxy most teams run?
No. The benchmark measured a Rust beta with logging callbacks, spend tracking and persistence off, on a path that Chat Completions and Messages do not take in main:latest. The Python proxy, which does serve those routes, is in the same sweep and adds 546.04 ms of p99 at concurrency 64, about 13.6x the Rust port.
Is LiteLLM Rust faster than Bifrost?
Sometimes, by small margins, in LiteLLM's sweep. Rust adds less p99 at concurrency 16 (+0.33 ms against +0.89 ms), the two are tied at 4, and Bifrost adds less at 1 and 64. Throughput differs by about 0.1% at concurrency 64. Rust records lower CPU in the sampled CPU files and lower peak RSS in three of four file sets and leads in an exploratory run at concurrency 256.
Does setting rust true make LiteLLM use the Rust gateway?
Not in main:latest. LiteLLM's Rust gateway page carries a warning that the per-model rust true flag currently has no effect, and that every route other than /ocr and Bedrock /audio/transcriptions, including Chat Completions and Messages, runs on Python.
How should I benchmark my LiteLLM proxy?
Point the proxy and a direct client at the same simulated upstream, sweep concurrency from 1 to beyond your production peak, and record p50, p99 and requests per second at each level. Run each level several times, record the release, worker count and hardware, and repeat with logging, budgets and callbacks configured as in production.