ToolsExplainer
Peak RSS vs memory at rest: reading LiteLLM's '9x less memory' figure
LiteLLM's homepage labels its memory figure 'memory at rest', but the data is peak RSS. What the files show, why Bifrost sat near 282 MB, and how to read RSS.
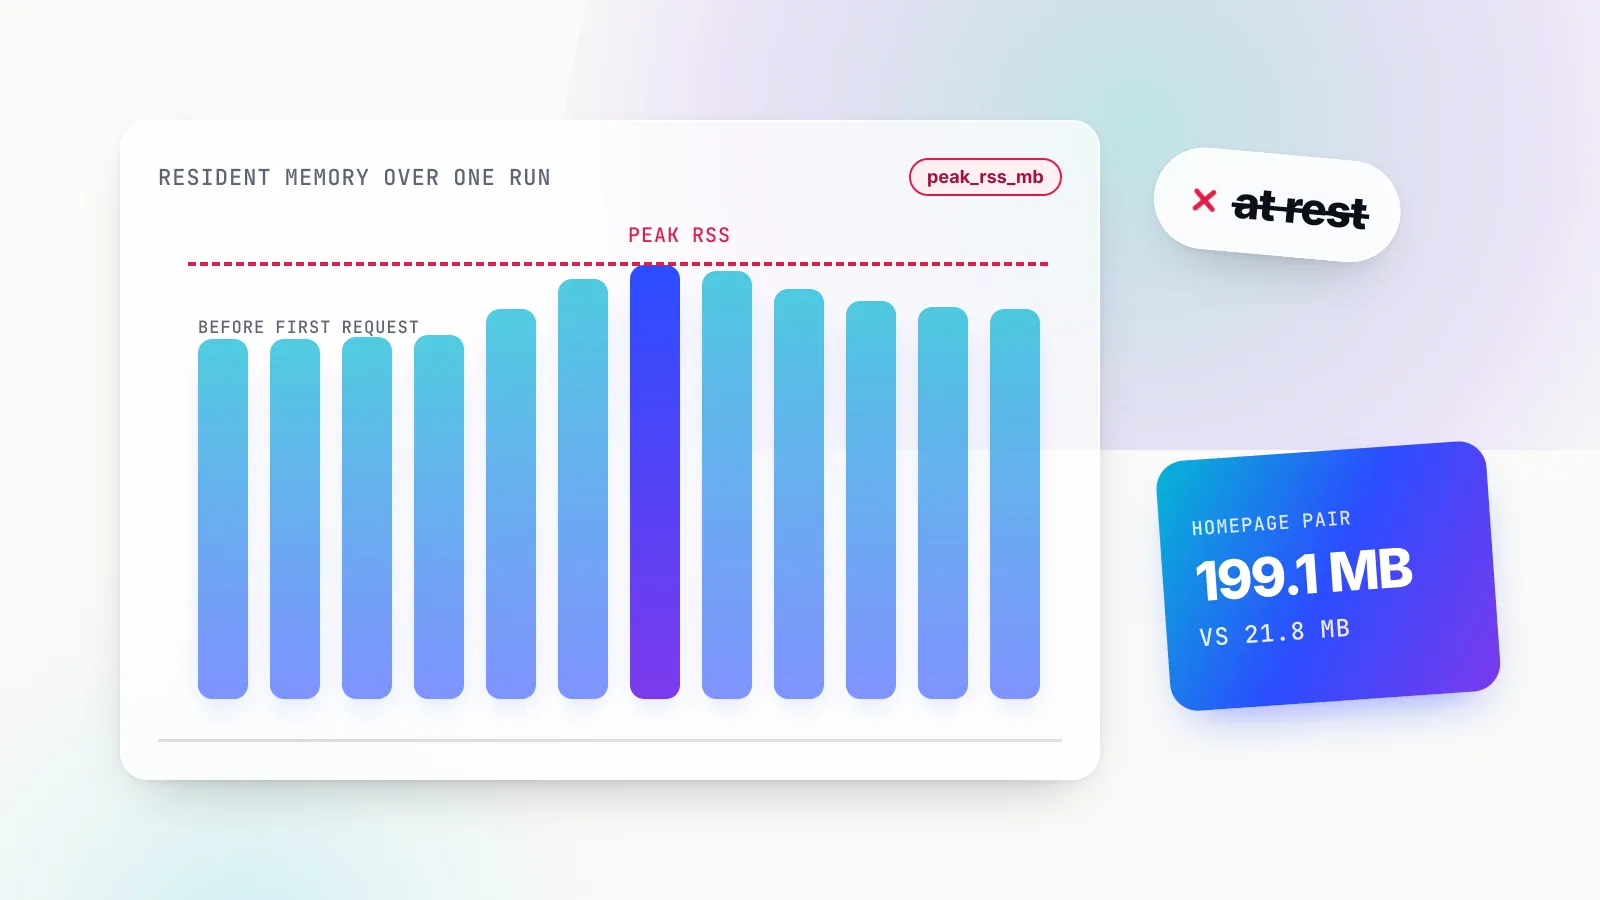
A peak RSS memory reading records the most RAM a process held during a run, not what it holds at rest. LiteLLM’s homepage shows its memory figure under a “memory at rest” label, but the data is peak RSS. The Rust gateway has lower peak RSS in three of four published file sets, while the ceiling run favors Bifrost, but the “9x less memory” headline rests on the widest of three non-ceiling memory pairs. For engineers sizing containers, the distinction decides whether the figure describes an idle process or the worst moment of a load test.
Source context: This analysis draws on LiteLLM’s published benchmark files and Maxim AI’s response. Maxim develops Bifrost, the competing gateway discussed here. No new performance tests were run for this article.
Correction, 5 November 2026: An earlier version omitted the throughput-ceiling file, overstated the consistency of Rust’s memory advantage, and, where discussed, incorrectly treated the approximately 21% CPU figure as unsupported. The ceiling file shows lower peak RSS for Bifrost and supports Rust’s rounded CPU figure.
Rust is smaller in three of four published file sets: the ceiling file instead records Rust at 297.1 MB and Bifrost at 242.6 MB. That result is the starting point here. What follows is narrower: which number the homepage used, what its label says it is, what the data behind it measured, and what an RSS reading can and cannot tell anyone about where memory goes.
Every figure here is checked against LiteLLM’s published files as of November 1, 2026. The piece is written for engineers who run an AI gateway, or are choosing one, and want to read memory figures the way an operator would.
Cross-check of the published resource files
LiteLLM Rust recorded lower peak RSS in three of four published file sets; Bifrost was lower in the ceiling run at 242.6 MB versus 297.1 MB for Rust. The ceiling results report 0.242614272 GB for Bifrost and 0.29710336 GB for Rust, converted here to decimal MB. The other three sets favor Rust: 21.8 MB versus 199.1 MB in the messages/release capture; 26.1 MB versus about 144 MB in the earlier memory capture; and roughly 35–36 MB versus 282–298 MB in the CPU time series. These are different measurements, not repeated trials of one identical setup.
The ceiling file also records Rust at 21.075% average CPU and 2,814.35 RPS. The separate CPU time series records a much lower average over its own sampling window. The figures must retain their file and workload context.
The Bifrost post identifies v1.6.4 as the tested build and infers default-on logging from v2.4.0 code; it explicitly says that behavior was not yet confirmed on v1.6.4. Neither the blog nor the benchmark files quantify logging’s share of the memory or CPU difference.
LiteLLM memory usage claims and the three non-ceiling pairs behind them
LiteLLM’s benchmark materials compare memory for its Rust gateway and Bifrost using three different pairs of figures from its own repo. The Rust gateway is smaller in those three captures, but not in the separate ceiling run. The homepage shows only the widest pair, 199.1 vs 21.8 MB, under a “memory at rest” label, but the figure is peak RSS.
The claim appears in two places. LiteLLM’s benchmark blog post says the Rust gateway has “roughly 7x lower overhead and 9x less memory than the next-closest gateway (Bifrost)”, and gives the memory as “21.8MB peak memory against 199.1MB”. The benchmark section of litellm.ai shows a tile reading about 22 MB for LiteLLM (Rust) and about 199 MB for Bifrost under the heading “Memory at rest”, with a chart note describing “resident memory with the gateway idle”.
The raw files sit in the results directory of LiteLLM’s ai-gateway-bench repo. The three non-ceiling captures and the ceiling run give four file sets:
| Files (Bifrost / Rust) | Bifrost | LiteLLM Rust | Ratio |
|---|---|---|---|
| mem_bifrost_messages.csv / mem_litellm_rust_release.csv | 199.1 MB | 21.8 MB | 9.1x (used on the homepage) |
| mem_bifrost.csv / mem_litellm_rust.csv | 144 MB | 26.1 MB | 5.4x |
| cpu_bifrost.csv / cpu_rust.csv | 282 to 298 MB | 35 to 36 MB | 8.3x |
| throughput_ceiling.csv | 242.6 MB | 297.1 MB | Bifrost lower by about 18% |
Figures as of November 1, 2026, from LiteLLM’s ai-gateway-bench repo.
Three things stand out. First, three captures favor Rust, but the ceiling row favors Bifrost. Second, the rows do not agree with each other: Bifrost’s figure ranges from 144 MB to nearly 300 MB depending on the file, and Rust’s from about 22 MB to about 297 MB. Third, the homepage takes the pair with the largest gap, which in the first row is a 177.3 MB difference.
It is worth being careful about what this proves. The pairs may come from different scenarios or builds, so the objection is to the label, not to the headline direction. A team reading these files should retain each scenario: Rust is lower in three captures and Bifrost in the ceiling run. Neither a single multiplier nor an across-the-board memory winner follows.
RSS memory, peak RSS and memory at rest are different numbers
RSS memory, or resident set size, is how much of a process’s memory sits in physical RAM at one moment. Peak RSS is the highest of those readings over a window. Memory at rest is a reading taken while the process serves no traffic. They coincide only when memory stays flat, and a label should say which one a figure is.
What resident set size counts
On Linux, the kernel exposes RSS in /proc/<pid>/status. The proc_pid_status manual page defines VmRSS as the resident set size and notes that it is the sum of three parts: RssAnon (resident anonymous memory, such as heap and stacks), RssFile (resident file mappings, such as the program binary and shared libraries) and RssShmem (resident shared memory). The same page warns that these values are “inaccurate” and points readers to /proc/<pid>/statm for the reason, a reminder that RSS is a cheap operational counter, not a precise accounting tool.
That composition matters for gateways. A process’s RSS includes memory the program asked for, pages of its own executable that have been read in, shared libraries, and any database or cache files it has mapped. It does not include memory that has been swapped out, and it does not say which part of the program owns any page.
Peak RSS is a high-water mark
The same manual page defines VmHWM as the “peak resident set size”, the high-water mark. A benchmark tool that samples RSS repeatedly and keeps the maximum produces the same kind of figure. Peak RSS answers the question an operator asks when setting a container memory limit: what is the most this process used during the run?
Peak RSS does not answer what a process costs when nothing is happening. A gateway can reach its peak in a short burst of requests and spend the rest of its life well below it, or it can sit at the same level throughout.
Memory at rest is a reading taken while idle
“Memory at rest”, “idle memory” and “baseline footprint” all describe resident memory measured while the process is up but serving no requests. It answers a different question: what does it cost to keep an instance running, for example as a sidecar in every pod or as a standby replica?
If a process’s RSS stays flat for the whole sampling window, its peak and its resting reading are the same number. If RSS rises under load, they diverge. Either way, the label is what tells the reader which question the number answers, and a label that names one measurement while the data records another leaves the reader unable to tell.
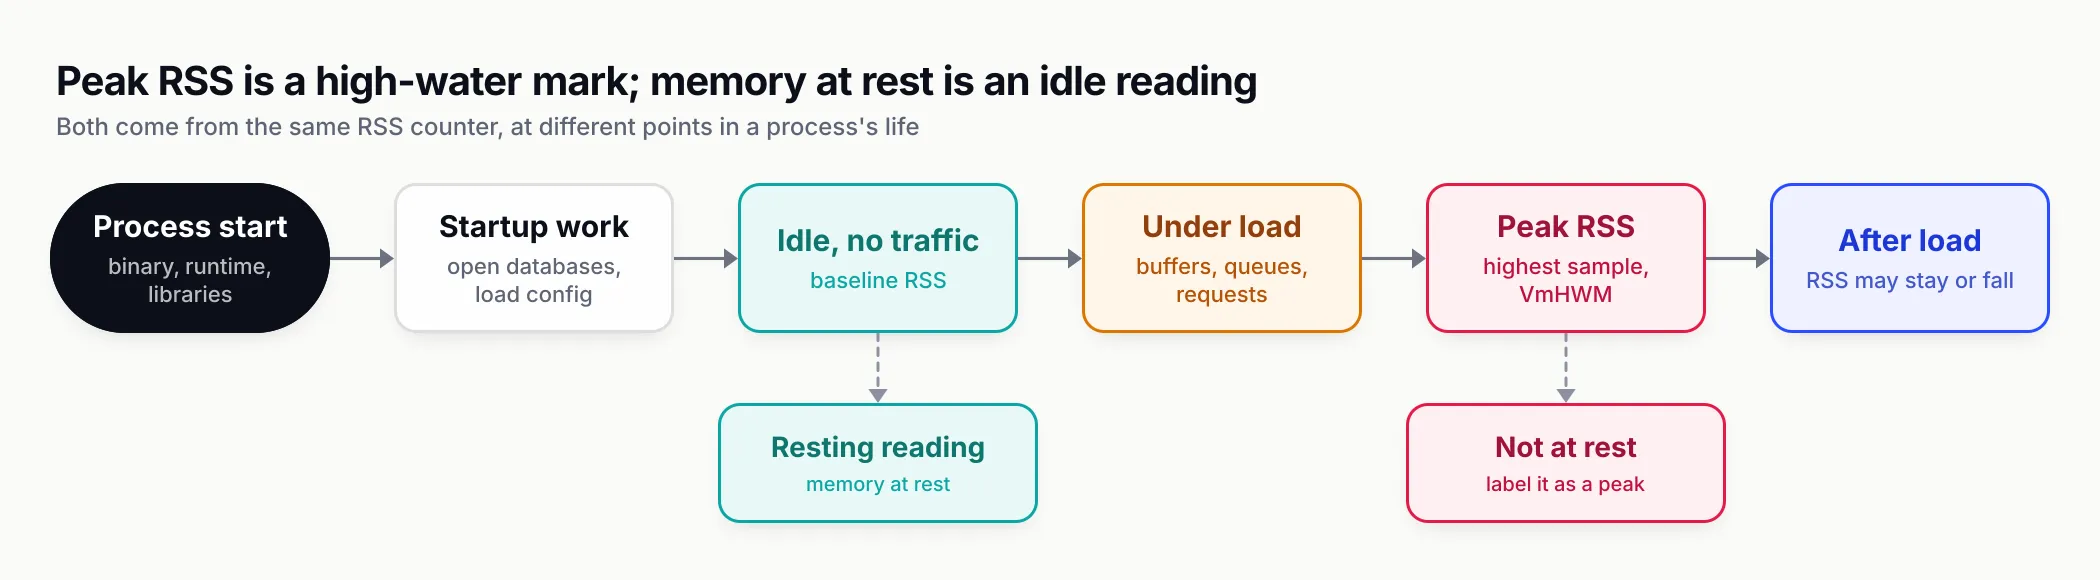
Figure 1: A resting reading and a peak reading come from different points in the same process’s life. Only the label tells a reader which one a published figure is.
The “memory at rest” label describes a peak RSS figure
The homepage tile is headed “Memory at rest” and its note says “resident memory with the gateway idle”, yet the same chart also says “peak RSS” and the underlying column is peak_rss_mb. The figure is peak RSS, not memory at rest. LiteLLM’s blog post, by contrast, correctly calls it peak memory.
As of November 1, 2026, the litellm.ai benchmark chart carries all three descriptions at once: “Memory at rest” as the heading, “peak RSS” in the chart, and “resident memory with the gateway idle” in the note. The column behind the figure is peak_rss_mb, so the homepage entry is mislabelled.
The blog post is cleaner. It describes the same pair as “21.8MB peak memory against 199.1MB”, which is the correct term. The two LiteLLM documents therefore describe the same pair of numbers differently, and it is the homepage, the version most readers see, that carries the wrong label.
Why it matters beyond wording
A label is not cosmetic when the audience is engineers making sizing decisions. Consider two readers of the tile:
- A platform team planning sidecars reads “memory at rest” as the cost of an idle gateway in every pod. If the figure is really a peak from a load run, the label has told them something the data did not measure.
- A team setting container limits wants the peak. A figure labelled “at rest” may lead them to assume there is headroom above it, when it may already be the maximum observed in that run.
The label also travels. LiteLLM’s blog says its cost estimate is built “from measured CPU, peak RSS, and sustained throughput on a 4 vCPU / 16 GB instance”. Peak RSS is therefore an input to the per-dollar claims as well as the memory tile, which is one more reason to be precise about which memory figure is which. The cost model itself is outside the scope of this explainer; GenAI Brief’s breakdown of the requests-per-dollar claim covers it.
Why the widest pair matters
Choosing the 199.1 vs 21.8 MB pair is not wrong in itself: it comes from LiteLLM’s files and Rust is smaller in three of four published file sets. The issue is that the tile presents one multiple as the memory result, when the same repo supports 9.1x, 5.4x or 8.3x depending on the file. Without the other pairs, a reader cannot see that the multiple ranges from 5.4x to 9.1x across files from the same benchmark. GenAI Brief has covered this pattern in vendor material more generally in how benchmarks became a marketing channel.
A 282 MB baseline before the first request
In LiteLLM’s own cpu_bifrost.csv, the Go gateway’s RSS is already about 282 MB before the first request, and load adds only about 16 MB. That points primarily to a baseline footprint rather than growth in the log buffer, though RSS alone cannot identify which components account for it.
This is the most useful single observation in the memory data, and it is easy to miss. The cpu_*.csv files record CPU and RSS together over a sampling window. In that file, the RSS column starts at about 282 MB before traffic arrives and peaks around 298 MB. In the matching Rust file, RSS sits at 35 to 36 MB.
What a flat line implies
If most of the gateway’s resident memory is present before any request arrives, then the large gap with Rust is mostly a difference in what each process holds at startup, not in how memory grows per request.
It also bears on the “at rest” wording. The homepage presents a pair from a different file, with a different figure (199.1 vs 21.8 MB), and its label describes an idle reading when the data is peak RSS.
What a flat line does not prove
One caveat has to stay attached to that reading: RSS alone cannot identify which components account for it. A 282 MB baseline could be made up of the runtime and binary, open database connections and their caches, plugin state, or memory allocated during startup that has not been returned to the operating system. RSS reports the total. It cannot rank the contributors.
The CPU time series has a limited sampling window: about 30 seconds, with roughly 2.3 seconds active according to the source post. The post speculates that this may correspond to a short cost run. The separate throughput-ceiling file records average CPU at the sustained-throughput point; these measurements should remain separate.
What can sit inside a gateway’s resident set size
A gateway’s RSS combines its runtime and code, caches such as a database page cache, queues and buffers such as a log writer’s batch, and per-request data. In Bifrost v1.6.4, two of these are documented in code: a SQLite page-cache setting of 10,000 pages and log writer flush bounds. Neither has a measured share of the RSS gap.
Two v1.6.4 components can hold memory before or during traffic. Both are real and both are bounded in some way, but the benchmark files do not quantify their contribution. They are listed here so engineers know where to look, not as an explanation of the 177.3 MB difference.
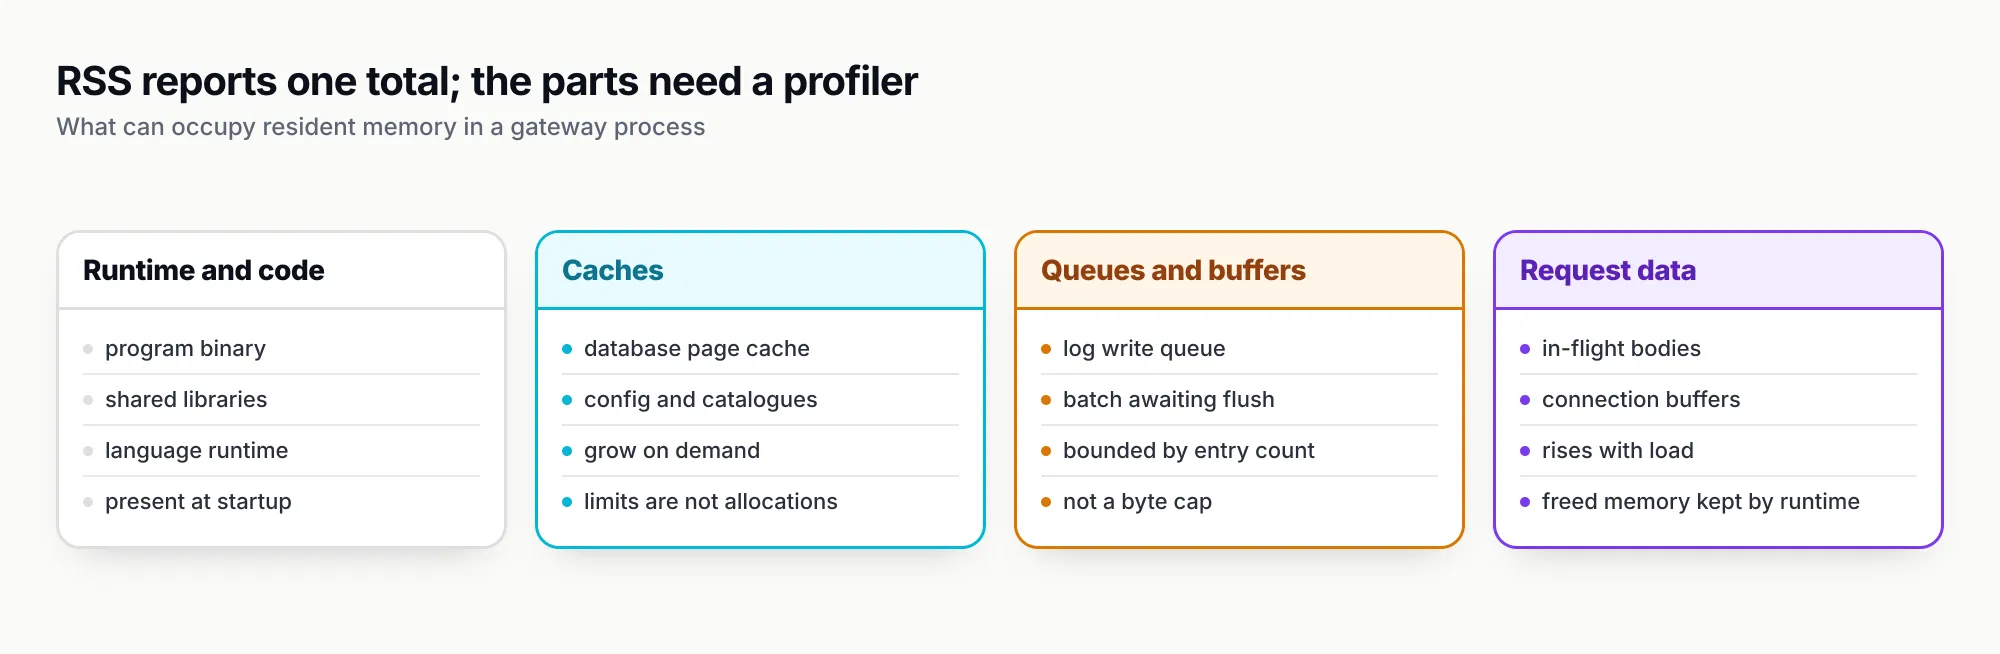
Figure 2: RSS adds these together. A profiler, not an RSS counter, is what separates them.
The SQLite page cache
Bifrost v1.6.4 opens a disk-backed logs.db and runs migrations at startup, configuring _cache_size=10000. The setting is visible in the v1.6.4 SQLite log store code. That is a suggested cache limit of 10,000 pages per connection, approximately 39.1 MiB at a 4 KiB page size.
Three qualifiers keep that number honest:
- It is a limit, not an allocation. The cache grows on demand; it is neither preallocated in full nor evidence that the entire database is loaded into RAM. The SQLite documentation for PRAGMA cache_size describes the value as the “suggested maximum number of database disk pages that SQLite will hold in memory at once per open database file”.
- It is per connection. The setting applies to each connection that opens the database, so total cache memory depends on how many connections are open and how many pages each has actually read.
- Its share is not quantified. SQLite’s caches and connection state can contribute to baseline RSS before benchmark traffic, but the files do not quantify that contribution or isolate logging’s share of the gap.
One more structural point: SQLite also contributes memory independently of the logging queue. Turning off one does not necessarily remove the other.
The log writer’s flush bounds
The second component is the asynchronous log writer. In v1.6.4’s log store configuration, the writer flushes at 1,000 entries, 5 seconds from the first entry, or 300 MiB of estimated payload, whichever comes first. A 10,000-entry queue brings queue-plus-batch capacity to approximately 11,000 entries, and new entries are dropped when the queue is full.
Those numbers are entry-count bounds and an approximate batch threshold, not a total memory cap. An entry count limits how many logs can wait, not how many bytes they occupy, because each entry’s size depends on the request and response it records. The 300 MiB figure is an estimate used to trigger a flush, not a ceiling on the process.
Three settings change that behaviour, each with a trade-off:
| Setting | Effect | Trade-off |
|---|---|---|
logs_store.writer.max_batch_size: 100, batch_interval: "1s", write_queue_capacity: 1000 | Lowers queue-plus-batch capacity to approximately 1,100 entries | Not necessarily 10x lower RSS; can increase write overhead and log drops under bursts |
client_config.disable_content_logging: true | Reduces logged payloads | Request and response bodies are no longer stored |
client_config.enable_logging: false | Removes the built-in logging plugin’s queue and hooks at startup | Other plugins remain enabled independently |
Settings and effects for v1.6.4.
Bifrost’s client configuration documentation lists enable_logging (“Log all LLM requests and responses”) and disable_content_logging, which defaults to false and strips message content from the log store while keeping metadata. Its storage documentation shows the logs_store block, which supports SQLite, PostgreSQL and ClickHouse backends.
The configuration behind the Bifrost memory figures
LiteLLM’s blog says every gateway ran with no logging callbacks, spend tracking or persistence. Its Bifrost config never sets enable_logging or logs_store, and the gateway defaults to logging on in that case. That finding is inferred from v2.4.0 code and not confirmed on v1.6.4, the build LiteLLM tested.
The memory numbers cannot be read without the configuration, because logging on and logging off are different workloads for a gateway’s memory. LiteLLM’s blog states that every gateway ran “with no logging callbacks, spend tracking, or persistence enabled”, and adds that “it is not a full-feature comparison.”
What the published Bifrost config sets
The config in the gateway folder in ai-gateway-bench sets a mock provider, config_store: enabled: false and no plugins. It never sets logs_store or enable_logging. This is what the gateway does with such a config:
enable_loggingdefaults to true when unset.- With
logs_storemissing, Bifrost creates a default SQLite log store. - The logging plugin is built in, so “no plugins” in the config does not turn it off.
config_store.enabled: falseonly leaves the config store empty; it does not turn off the log store or the plugins.disable_content_loggingdefaults to false, so request and response bodies are logged too.- Other built-in plugins load independently: telemetry is on unless disabled, governance is on in the open-source build, routing loads with governance, and a compatibility plugin is always registered.
The hedge that has to travel with it
This is the most contested point, and its limit is plain: the logging finding is an inference from v2.4.0 code, not yet confirmed on v1.6.4. The code is from v2.4.0, while the benchmark ran v1.6.4, a build several releases older. Anyone repeating the claim that logging was on should carry that qualifier with it.
The LiteLLM Rust config was not checked, so the comparison of configurations is one-sided: Bifrost’s config was examined, Rust’s was taken at the blog’s word.
Versions
The tested versions are Bifrost v1.6.4 against a LiteLLM Rust beta whose blog describes it as “an early beta, streaming and the full feature surface are still landing.” Bifrost’s changelogs list v1.6.5 to v1.6.11 and then v2.0.0 to v2.4.0 after the tested build. Bifrost 2.x is reported to have since substantially reduced memory usage by changing what data it retains and how it stores it in memory, improvements the v1.6.4 benchmark does not reflect. No figure for the reduction has been published; that is left to Maxim’s Part 2.
For readers of LiteLLM’s Rust coverage more broadly, the LiteLLM Rust gateway documentation is the place to check which routes use Rust in a given release. The memory figures here describe the benchmarked Rust beta, not every LiteLLM deployment.
What a heap profile shows that RSS cannot
A heap profile records which allocation sites hold live memory, so it can show how much of a gateway’s footprint belongs to a log buffer, a cache or anything else. RSS cannot. Maxim’s proposed Part 2 follow-up will take heap profiles on a current Bifrost build, with logging on and off, to explain the remaining memory gap.
RSS is a total from the operating system’s point of view. A heap profile is a breakdown from the program’s point of view. For a Go program, the standard tool is the runtime/pprof package, whose documentation says the heap profile “tracks both the allocation sites for all live objects in the application memory” and reports statistics “as of the most recently completed garbage collection”. That is the kind of evidence needed to say “the log queue holds X” rather than “the log queue might hold some of this”.
Even a heap profile has limits. It covers memory the language runtime allocates, so pages held by C libraries, memory-mapped files or a runtime’s own overhead may not appear in it. Comparing the heap profile’s total with RSS is itself informative: a large difference points to memory outside the managed heap.
What Maxim’s Part 2 will measure
Maxim’s Part 2 commits to four things:
- Run both gateways with logging off, and again with logging on.
- Use a current Bifrost build, repeated trials and error bars.
- Publish hardware, worker counts, mock latency and concurrency for every run.
- Take a heap profile to measure how much of the memory gap is the log buffer.
Two outcomes are possible, and both are worth reporting. If logging accounts for much of the gap, the configuration mismatch explains a meaningful part of the 9x headline. If the gap persists with logging off, the Rust beta’s smaller footprint stands on its own. The ceiling run already shows that the ranking can reverse; a controlled rerun is needed to compare equivalent workloads.
How to measure AI gateway memory footprint yourself
To measure a gateway’s memory footprint, record RSS as a time series from process start rather than a single number, then report the reading before traffic, the peak under load and the reading after load. Pin the version and configuration, run with the features you will use in production on and off, and repeat runs.
The LiteLLM files are a useful worked example of what to publish and what to avoid. A memory figure that another team can act on carries its conditions with it. The checklist below follows from the gaps in LiteLLM’s materials: no machine type, core count or worker count given for either gateway; single runs without error bars; and one label covering three different measurements.
- Sample RSS from process start. Capture the reading before the first request. In LiteLLM’s data, that single number (about 282 MB for Bifrost in one file) told more about the footprint than the peak did.
- Report three readings, labelled. Before traffic, peak under load, and after load ends. Never put a peak under an “idle” or “at rest” heading.
- Pin versions and configuration. Name the exact build of each gateway and publish the config files. A memory figure for an old build or an unknown config cannot be compared with a current deployment.
- Match features, or test both ways. Logging, content logging, caches and plugins all hold memory. Run with them off for a like-for-like floor, and on for what production will see.
- Repeat runs and show the spread. The three LiteLLM pairs differ widely for the same two gateways. One run per scenario cannot show whether a figure is typical.
- Publish the hardware. Memory behaviour depends on core counts, worker counts and runtime settings. Without them, a result cannot be reproduced.
- Profile before attributing. If the conclusion is “component X uses the memory”, show a heap profile or a configuration-off comparison that isolates X.
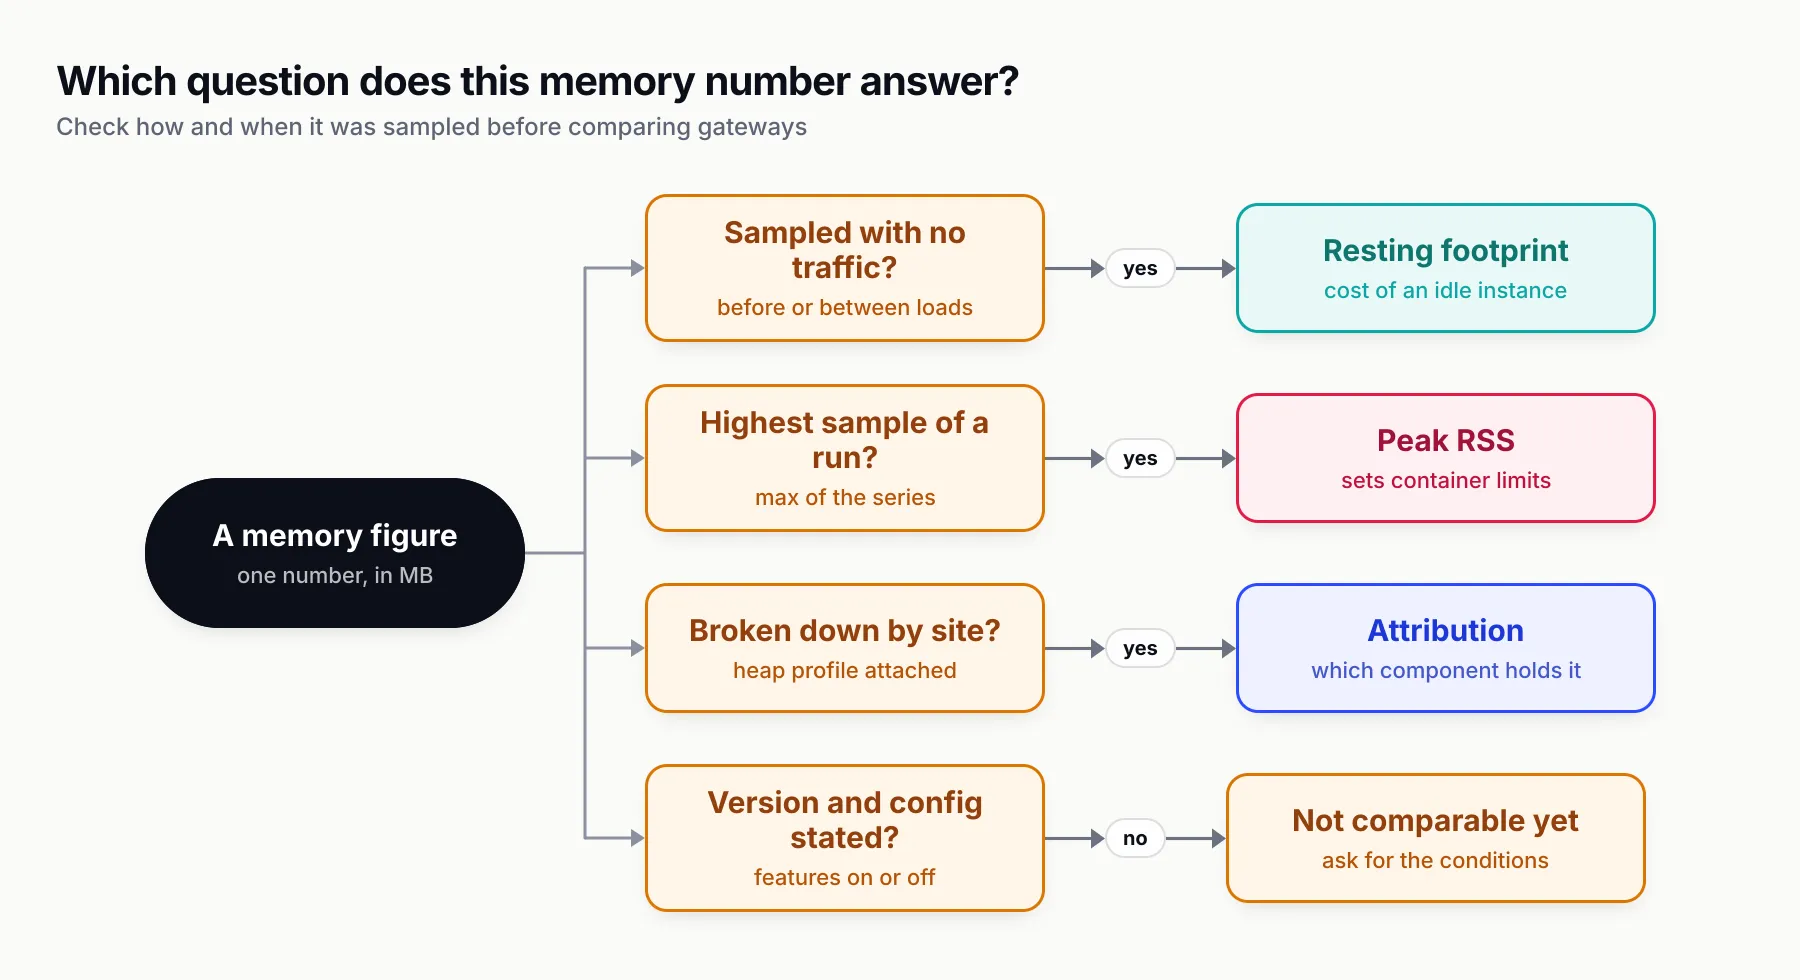
Figure 3: The same RSS counter can support three different claims. The label and the conditions decide which one a figure is fit for.
For readers who want the wider context on why a gateway sits in the request path at all, and which features hold state, GenAI Brief’s explainer on what an AI gateway is covers the architecture, and its guide to LLM observability covers what request logging captures and where it is stored. Teams weighing a move off LiteLLM can find the broader trade-offs in LiteLLM alternatives in 2026.
For how much of LiteLLM the benchmarked Rust beta actually covers, GenAI Brief’s explainer on whether LiteLLM is written in Rust sets out the migration status.
Worked examples
A team running one gateway per pod. Here the resting footprint dominates the bill, because every pod pays it. The useful figure is the pre-traffic reading, and the useful comparison is between builds and configurations the team would actually deploy. The published memory results are mixed: Rust is lower in three non-ceiling captures, including 21.8 MB versus 199.1 MB; Bifrost is lower in the ceiling run at 242.6 MB versus 297.1 MB. These files do not isolate the contribution of logging.
A team running a few shared gateway replicas. Here the peak under realistic load matters more, because it sets the memory limit for each replica. A peak from a mostly idle 30-second window says little about sustained traffic, and a single run says nothing about variance.
A team that needs request logs. For them, a benchmark with logging off is not the configuration they will run. The relevant comparison is both gateways with logging on, which is one of the runs Maxim’s Part 2 commits to. In the meantime, the Bifrost settings in the table above show which levers exist and their documented trade-offs.
Bifrost-specific settings worth knowing
For teams already running Bifrost, an open-source AI gateway, the client and storage settings above are the documented controls over logging.
Its log store architecture page describes SQLite as “the default, file-based database, ideal for local development and smaller, single-node deployments”, with PostgreSQL and ClickHouse as alternatives.
What engineers should take from the 9x memory figure
The 9x memory figure is real arithmetic on a real pair from LiteLLM’s files, and the Rust beta is smaller in that pair; Bifrost is smaller in the ceiling run. What is wrong is the label: the homepage calls the figure “memory at rest”, but it is peak RSS. The homepage also shows only the widest of three non-ceiling pairs, measured against an old build of the Go gateway that appears to have had logging on.
The fair reading has three parts. First, the ranking is scenario-dependent: Rust is lower in three published sets and Bifrost in the ceiling run. Second, the roughly 9x headline describes only the 199.1 MB versus 21.8 MB pair, whose label must say peak RSS. Third, the cause is unresolved: RSS and the published configuration cannot quantify how much memory belongs to logging, SQLite or the runtime.
For anyone citing LiteLLM memory usage figures, the practical rule is to quote the pair with its file and its measurement type: “199.1 MB vs 21.8 MB peak RSS, Bifrost v1.6.4 vs the LiteLLM Rust beta, as of November 1, 2026.” That sentence matches the column the files record. “9x less memory at rest” does not.
For anyone publishing memory figures, the LiteLLM case shows how the same pair can read “peak memory” in a blog post and “memory at rest” on a homepage tile. The fix is cheap: label every RSS figure by when it was sampled, publish the time series, and state the version and configuration beside the number. Heap profiles, which Maxim’s Part 2 follow-up is set to publish, are what will turn “points to baseline footprint” into an attribution.
Source: Debunking LiteLLM Rust Benchmarking: Part 1, by Akshay Deo of Maxim AI, which builds the Bifrost gateway.
Sources
- Throughput ceiling results: memory, CPU and sustained RPS
- Debunking LiteLLM Rust Benchmarking: Part 1 Maxim AI
- LiteLLM homepage benchmark section LiteLLM
- Rust AI gateway benchmarks (LiteLLM blog) LiteLLM
- ai-gateway-bench results directory BerriAI (GitHub)
- ai-gateway-bench Bifrost gateway configuration and README BerriAI (GitHub)
- LiteLLM Rust gateway documentation LiteLLM
- proc_pid_status(5): /proc/pid/status fields Linux man-pages project
- SQLite PRAGMA cache_size SQLite
- Bifrost v1.6.4 SQLite log store setup (sqlite.go) Maxim AI (GitHub)
- Bifrost v1.6.4 log writer defaults (config.go) Maxim AI (GitHub)
- Bifrost client configuration (config.json) Maxim AI
- Bifrost storage configuration (config.json) Maxim AI
- Go runtime/pprof package documentation The Go Authors
Frequently asked questions
Does LiteLLM Rust use 9x less memory than Bifrost?
Not in every published file set. Rust records lower peak RSS in three of four sets, including 21.8 MB versus 199.1 MB, but Bifrost is lower in the ceiling run at 242.6 MB versus 297.1 MB. The roughly 9x figure describes one pair, not every workload. The Bifrost post infers default-on logging from v2.4.0 code and says it was not yet confirmed on the tested v1.6.4 build; the files do not measure logging's share.
What is RSS memory?
RSS, or resident set size, is the amount of a process's memory currently held in physical RAM. On Linux, /proc/pid/status reports it as VmRSS, the sum of resident anonymous memory, file mappings and shared memory. It is a single total for the process and does not say which code or data structure owns the pages.
What is the difference between peak RSS and memory at rest?
Peak RSS is the highest resident memory a process reaches during a measurement window; Linux reports it as VmHWM, the high-water mark. Memory at rest, or idle memory, is resident memory read while the process is serving no traffic. The two can match if memory stays flat, but they answer different questions and should be labelled separately.
Why was Bifrost's memory higher in LiteLLM's benchmark?
The files do not say. Bifrost's RSS was about 282 MB before the first request, which points to baseline footprint. Bifrost v1.6.4 opens a SQLite log database with a 10,000-page cache setting, and logging appears to have been on, but the share of RSS from each component is not quantified.
Was logging enabled for Bifrost in LiteLLM's benchmark?
Probably, though it is not confirmed. LiteLLM's blog says every gateway ran with no logging callbacks, spend tracking or persistence, but its Bifrost config never sets enable_logging or logs_store. Logging defaults to on in that case, an inference from v2.4.0 code not yet confirmed on v1.6.4.
How do you measure an AI gateway's memory footprint?
Record RSS as a time series from process start, not one number. Report the reading before the first request, the peak under load and the reading after load ends, with the version, configuration and features enabled. To explain where the memory goes, add a heap profile, and repeat runs to show how much the figures vary.