ToolsAnalysis
The '4.5x more requests per dollar' claim is a model, not a measurement
LiteLLM cost claims for its Rust gateway rest on an assumed 4 vCPU / 16 GB instance. What the 4.5x, 5.8x and 4.4x ratios measure, and what is missing.
LiteLLM cost claims for its new Rust gateway include a headline that its own files support arithmetically: about 4.5 times as many requests per dollar as Bifrost. The arithmetic is right. The figure is still not a measured saving. It is the output of a cost model, priced on an assumed 4 vCPU / 16 GB instance rather than on the machine the benchmark ran on, and its inputs are not shown on the page that carries the claim.
Source context: This analysis draws on LiteLLM’s published benchmark files and Maxim AI’s response. Maxim develops Bifrost, the competing gateway discussed here. No new performance tests were run for this article.
Correction, 5 November 2026: An earlier version omitted the throughput-ceiling file, overstated the consistency of Rust’s memory advantage, and, where discussed, incorrectly treated the approximately 21% CPU figure as unsupported. The ceiling file shows lower peak RSS for Bifrost and supports Rust’s rounded CPU figure.
That distinction matters to anyone using the number to choose or size an AI gateway. A measured saving would mean someone ran both gateways, paid for the hardware, and compared the bills. A modelled saving means someone took resource readings from a benchmark, attached a price to an imagined machine, and divided. Both can be useful. Only one of them tells a team what it will actually spend, and the difference sits in assumptions a reader cannot see.
This analysis works through what LiteLLM published on its homepage, in its benchmark blog post and in the CSV files of its ai-gateway-bench repo, as of November 1, 2026. It reports what the files show in the Rust gateway’s favour, including lower CPU use, separates the three different cost ratios that appear across LiteLLM’s materials, and sets out what a cost comparison would need before an engineering team could plan around it.
Cross-check of the published resource files
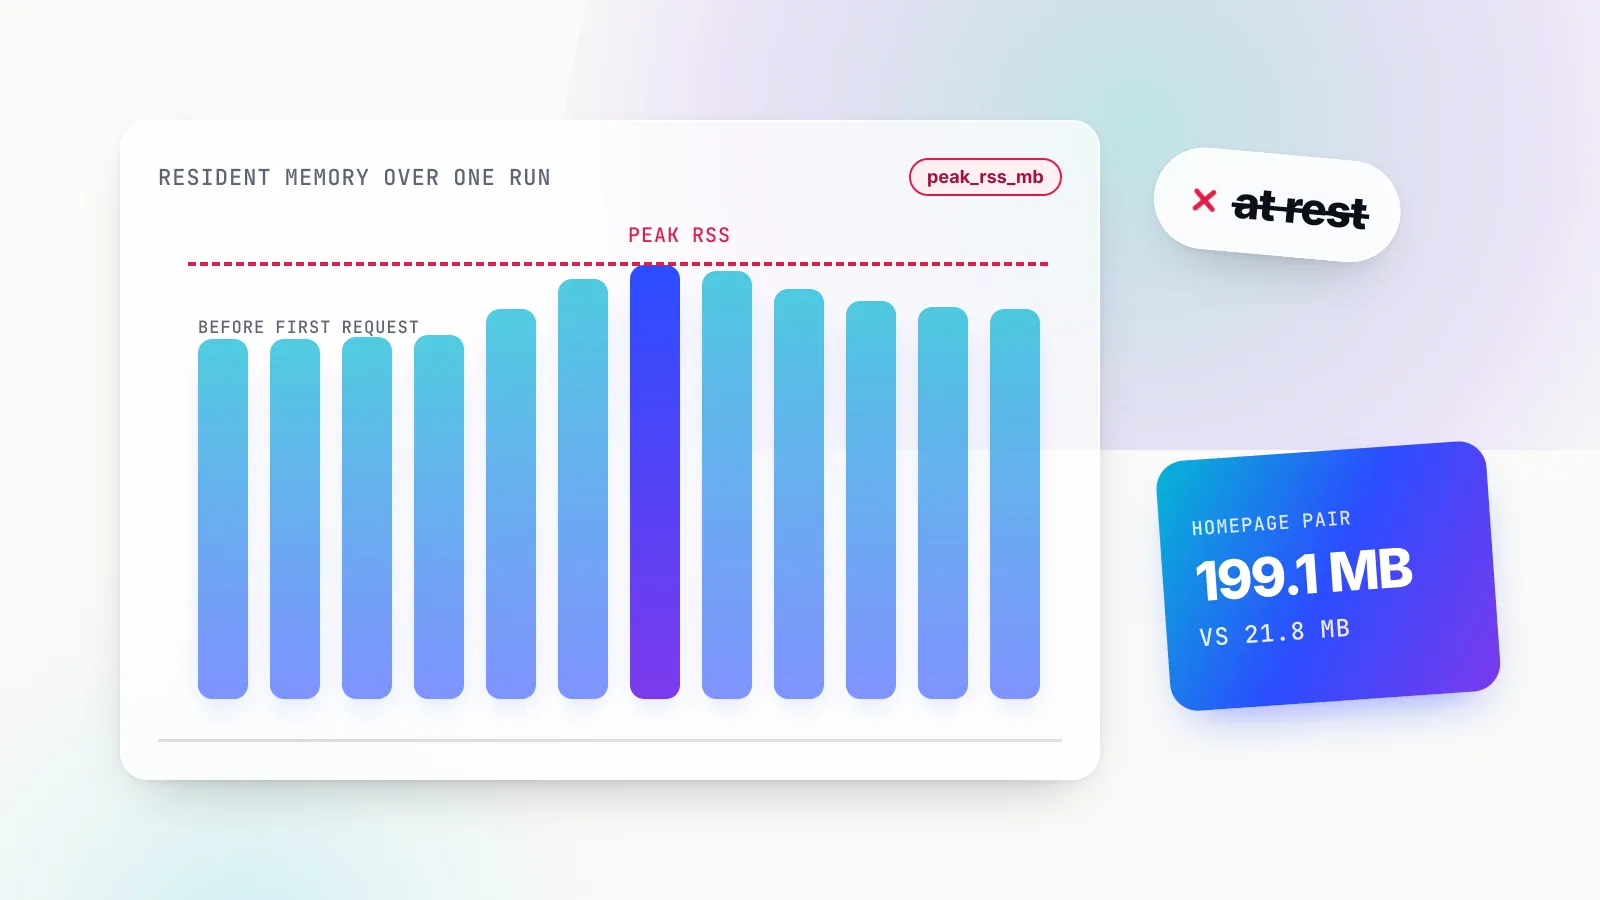
LiteLLM Rust recorded lower peak RSS in three of four published file sets; Bifrost was lower in the ceiling run at 242.6 MB versus 297.1 MB for Rust. The ceiling results report 0.242614272 GB for Bifrost and 0.29710336 GB for Rust, converted here to decimal MB. The other three sets favor Rust: 21.8 MB versus 199.1 MB in the messages/release capture; 26.1 MB versus about 144 MB in the earlier memory capture; and roughly 35–36 MB versus 282–298 MB in the CPU time series. These are different measurements, not repeated trials of one identical setup.
The ceiling file also records Rust at 21.075% average CPU and 2,814.35 RPS. The separate CPU time series records a much lower average over its own sampling window. The figures must retain their file and workload context.
The Bifrost post identifies v1.6.4 as the tested build and infers default-on logging from v2.4.0 code; it explicitly says that behavior was not yet confirmed on v1.6.4. Neither the blog nor the benchmark files quantify logging’s share of the memory or CPU difference.
The LiteLLM cost claim and the three ratios behind it
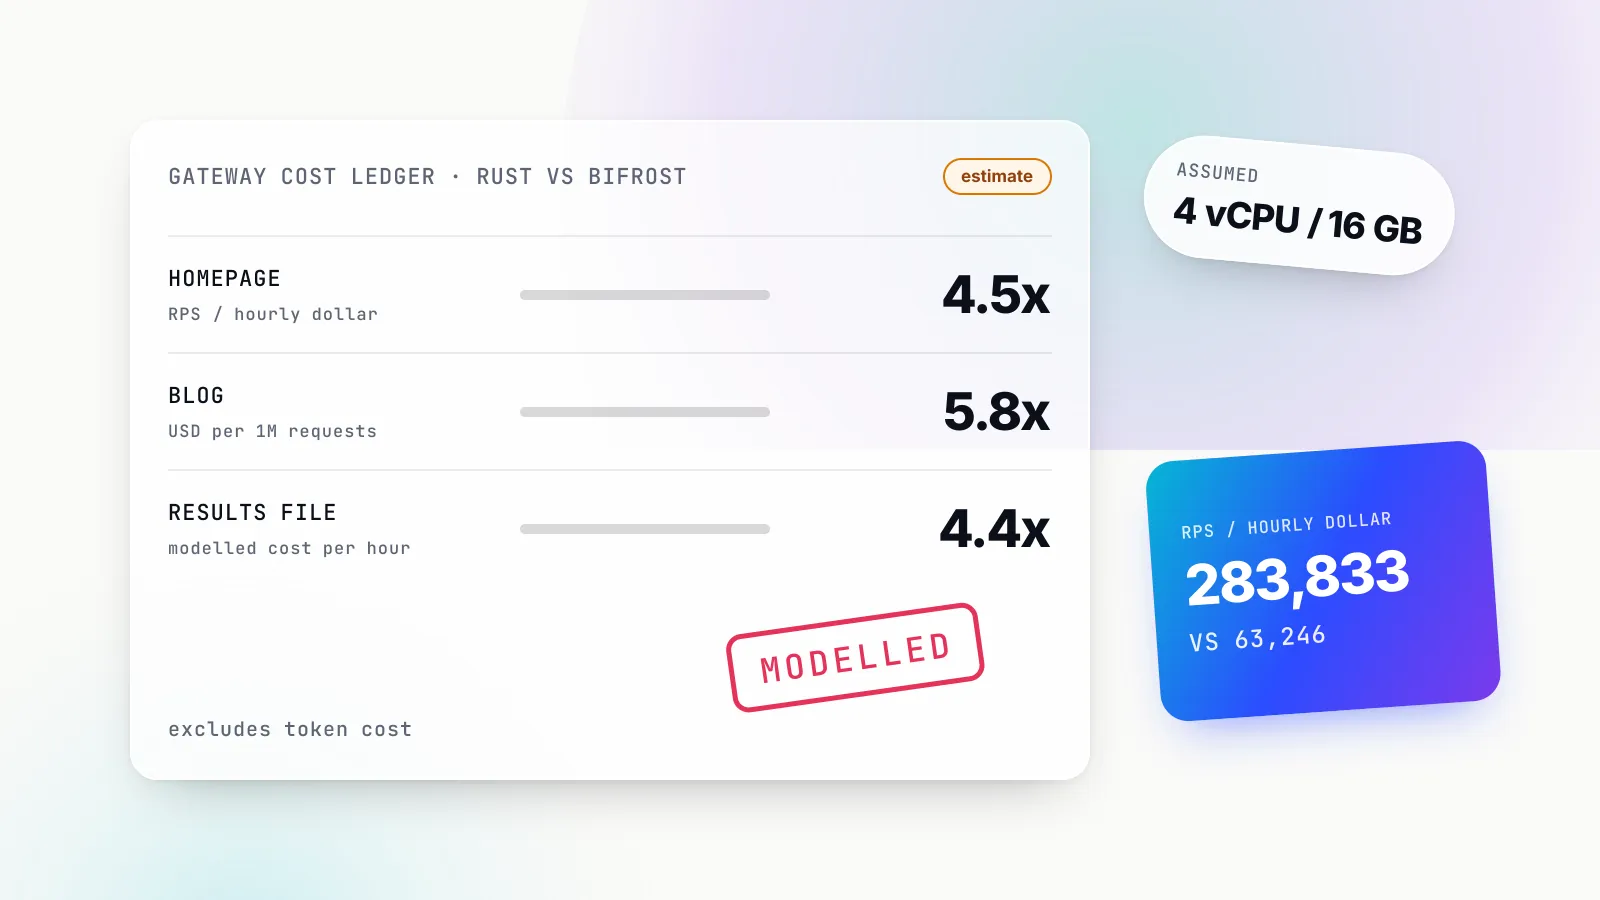
LiteLLM’s materials state the Rust gateway’s cost advantage three ways: about 4.5x more requests per dollar on the homepage, “roughly 6x” lower cost per million requests in the blog, and 4.4x lower hourly cost in the results file. These are different reported cost summaries; the cited material does not establish that they use identical inputs or scenarios, and none is a measured production bill.
The homepage version is the shortest. The benchmark section of litellm.ai says the Rust gateway delivers “~4.5x more requests per dollar”. The repo file behind it, rps_per_dollar.csv, records 283,833 RPS per dollar of estimated hourly cost for the Rust gateway and 63,246 for Bifrost. The division checks out: 283,833 / 63,246 is 4.5x. On that point LiteLLM’s claim is accurate. The arithmetic holds.
The blog version uses a different unit. LiteLLM’s benchmark blog post describes an “Estimated USD per one million requests from measured CPU, peak RSS, and sustained throughput on a 4 vCPU / 16 GB instance”, and says the Rust gateway lands at “about $0.000175, roughly 6x below Bifrost ($0.001008)”. 0.001008 / 0.000175 is about 5.8x, and this is a different metric from the page’s 4.5x, which is per dollar-hour.
The third ratio is in the same CSV. It gives a modelled cost of $0.0434 per hour for Bifrost and $0.0099 for the Rust gateway, a 4.4x ratio. That hourly footprint is derived from resource measurements. It is not an independent result showing the same savings in production.
| Ratio | Where it appears | What it compares | Bifrost | LiteLLM Rust |
|---|---|---|---|---|
| ~4.5x | litellm.ai homepage | Requests per dollar-hour | 63,246 | 283,833 |
| “roughly 6x” (about 5.8x) | LiteLLM blog | Estimated USD per 1M requests | $0.001008 | $0.000175 |
| 4.4x | rps_per_dollar.csv | Modelled cost per hour | $0.0434 | $0.0099 |
All figures as of November 1, 2026, from LiteLLM’s homepage, blog and ai-gateway-bench repo. Every row is an estimate on an assumed 4 vCPU / 16 GB instance.
The three summaries use different denominators and may draw on different scenarios. Each ratio can be checked arithmetically, but a reader should not assume they are interchangeable outputs of one identical set of measurements. Keep the cost-per-million chart separate from the ceiling-based hourly-cost and RPS-per-dollar outputs.
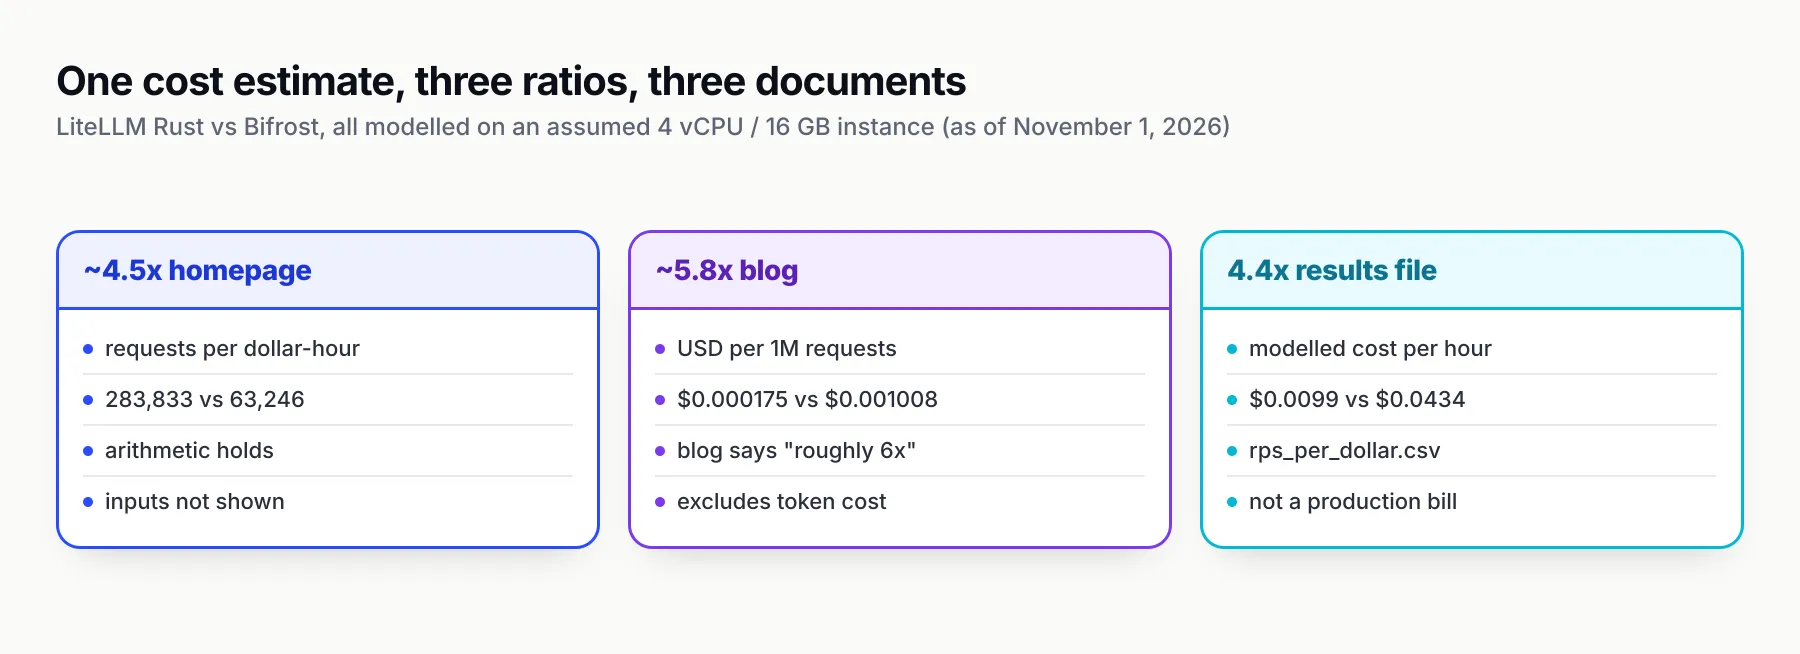
Figure 1: Three reported cost summaries use different denominators and may use different runs; none is a measured production bill.
What rps_per_dollar.csv records
The rps_per_dollar.csv file pairs a sustained request rate for each gateway with an estimated hourly cost and a requests-per-dollar-hour figure, at a ceiling concurrency of 64. Its sustained rates, 2,744 requests per second for Bifrost and 2,814 for the Rust gateway, do not match the main latency sweep at the same concurrency.
The file is the closest thing to a cost worksheet that LiteLLM publishes, and it is worth reading closely, because every cost ratio above traces back to it.
The throughput the model is built on
The file records 2,744 requests per second for Bifrost and 2,814 for the Rust gateway, and its throughput point uses ceiling_concurrency = 64. The main sweep, latency_vs_concurrency.csv, measures the same two gateways at concurrency 64 at 2,719.1 and 2,722.2 requests per second. The gap between the two gateways is 2.5% or less: 2.5% in the cost file and 0.1% in the sweep.
That gap matters to a per-dollar figure, because throughput is one of the two things being divided. A cost model built on the cost file starts from a Rust advantage that the sweep at the same concurrency does not show. The difference is small, a few percent, but it is a reminder that the inputs come from specific runs, and that the repo contains other runs of the same scenario with different results.
The latency in the same file
The file also records total p99 latency, and here the disagreement with the sweep is larger. At concurrency 64, Bifrost’s total p99 is as 52.7 ms in the sweep and 32.2 ms in rps_per_dollar.csv, and the Rust gateway’s is 64.3 ms in the sweep and 26.9 ms in the cost file. These are single runs, so small gaps are not stable, and the ranking flips between LiteLLM’s own files.
For a cost reader, the point is not which latency figure is right. It is that two files describing the same gateways at the same concurrency disagree enough to reverse the order, and the cost model inherits whichever run it was fed. LiteLLM’s blog is open about this limit in general terms. It describes the benchmark as “Single-host, per-scenario runs (for example n=5000 on the overhead panel) without repeated-trial error bars”, tells readers to “treat them as order-of-magnitude differences”, and calls it “a vendor-run benchmark”. The homepage tile carrying the 4.5x does not repeat that caveat.
What the file does not show
The CSV contains the throughput, estimated hourly cost and their ratio. The repository also publishes ceiling-run CPU and RSS plus pricing assumptions in its chart code. The homepage tile does not explain those steps; readers should follow the data and assumptions rather than treat the result as a measured bill. Logging’s contribution remains unquantified.
Cost modelling is not cost measurement
Cost modelling estimates what something would cost by combining measured or assumed inputs with a pricing rule. Cost measurement records what was actually spent. LiteLLM’s 4.5x is the first kind: resource readings from a benchmark, priced on a 4 vCPU / 16 GB instance that the benchmark did not run on.
The phrase “requests per dollar” sounds like an observed quantity, the sort of number that comes off an invoice. It is not. No dollars were spent in producing it. A model took readings, applied a price and produced a ratio. That is a legitimate exercise, and engineers do it constantly when sizing infrastructure, but it has properties a reader needs to keep in mind.
What a cost model can show
A cost model is good at answering a conditional question: if these readings held, on this machine, at this price, what would the bill be? It makes resource differences legible. “Gateway A uses less CPU” becomes “gateway A would need less of a machine”, which becomes a dollar figure a budget holder can read. LiteLLM’s blog frames its figure in exactly this way, as an estimate built from measured resources.
The published hourly model is lower for Rust in its ceiling scenario. That result must be kept separate from an across-the-board resource claim: CPU is lower for Rust in the ceiling row, but peak RSS is lower for Bifrost.
What a cost model cannot show
A model cannot show that the saving exists in production. It inherits every assumption it is given: the readings, the machine, the price, the load the readings were taken under and the features that were switched on. If any of those differ from a team’s deployment, the dollar figure does not transfer. LiteLLM’s hourly figure is exactly this kind of output: derived from resource measurements, not observed as a saving in production.
A model needs a published rule and unit prices. The repository’s analyze/make_agent_charts.py includes a caption giving CPU and memory pricing assumptions for the RPS-per-dollar chart. The ceiling file supplies the CPU and RSS inputs; those assumptions are inspectable, even though the homepage tile alone does not explain them. Inspectable assumptions still do not turn an estimate into an observed production bill.
Why the multiplier travels further than the caveats
A ratio is the most portable part of any model. “4.5x more requests per dollar” fits on a homepage tile, a slide or a procurement note. The conditions behind it, an assumed instance, single runs, a configuration difference, do not. GenAI Brief has written about this pattern more generally in how benchmarks became a marketing channel: the number survives, and the footnote does not.
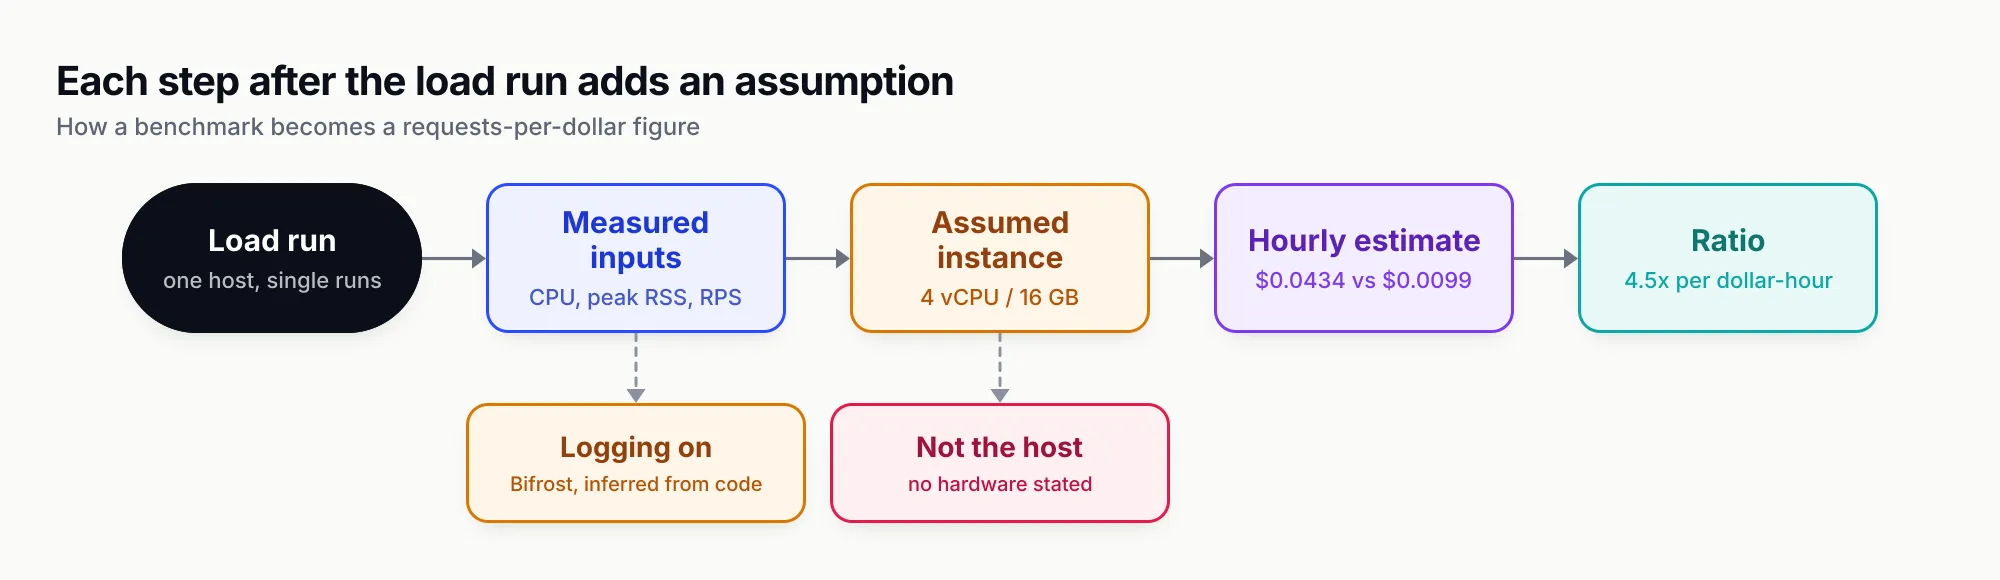
Figure 2: Every step after the load run adds an assumption. The ratio at the end is only as transferable as the least transferable step.
The three inputs: CPU, peak RSS and sustained throughput
LiteLLM’s blog says its estimate uses measured CPU, peak RSS and sustained throughput. The sampled CPU series favors Rust, while peak RSS favors Rust in three sets and Bifrost in the ceiling run. But each input carries a condition: a short sampling window, a memory label in dispute, single runs, and the version-qualified inference of logging enabled for Bifrost.
CPU: where the Rust gateway leads
The CPU files favour the Rust gateway clearly, and on direction there is nothing to qualify. In cpu_bifrost.csv and cpu_rust.csv, Bifrost averages 2.59% CPU with a peak of 79.5%, and the Rust gateway averages 0.66% with a peak of 15.9%. That is approximately 3.9x the mean and 5x the peak. These are whole-process measurements under the configurations described below.
Two conditions belong to that CPU sampling series. Neither proves that it supplied the separate ceiling-based hourly estimate.
- The window is mostly idle. The figures are averaged over a 30-second window, about 2.3 seconds of which was active. A mean over a mostly idle window says more about background activity than sustained load. The Bifrost peak falls inside the roughly two-second request burst, and the files do not separate request handling from background work.
- The load may not match the throughput. The CPU samples appear to come from a short burst, probably the concurrency-16 cost runs (1,000 requests each). This is an inference, not confirmed. That does not displace the separate ceiling row, which records CPU and sustained RPS together. For reference, those cost runs record a p50 of 22.99 ms and a p99 of 262.4 ms for Bifrost, and a p50 of 22.48 ms and a p99 of 263.9 ms for the Rust gateway.
The separate throughput-ceiling file records LiteLLM Rust at 2,814.35 requests per second and 21.075% average CPU, so it supports the rounded 2,800+ RPS at approximately 21% CPU figure. The 0.66% mean and 15.9% peak in cpu_rust.csv belong to a different sampling series and should not be substituted for that ceiling-run measurement. Published ceiling results.
None of this reverses the CPU result. In every CPU file cited here, the Rust gateway uses less CPU than Bifrost. What it limits is the step from “less CPU in a mostly idle 30-second window” to “this much less on a machine under sustained load”, A cost model must identify the resource measurement it actually uses.
Peak RSS: a smaller footprint with a disputed label
Memory is another resource input, but its direction differs across the published file sets. The ceiling file instead records Rust at 297.1 MB and Bifrost at 242.6 MB. The pair LiteLLM headlines is 199.1 MB against 21.8 MB. The repo also holds pairs of 144 MB against 26.1 MB and 282 to 298 MB against 35 to 36 MB, with ratios of 9.1x, 5.4x and 8.3x, and the homepage uses the widest pair.
The blog names peak RSS as a cost input. The homepage’s “memory at rest” label is mislabelled peak RSS, a question GenAI Brief covers in detail in LiteLLM’s 9x memory figure and what peak RSS measures. For the cost model, the relevant points are narrower. First, a cost model must identify its memory input; the ceiling run has a different memory ordering from the three non-ceiling captures. Second, Bifrost’s RSS is already about 282 MB before the first request in cpu_bifrost.csv, and load adds only about 16 MB, which points to baseline footprint. RSS alone cannot say which components account for it.
Sustained throughput: close to a tie
The third input is the one where the two gateways are closest. In the main sweep at concurrency 64, Bifrost delivers 2,719.1 requests per second and the Rust gateway 2,722.2, with Bifrost keeping 95.2% of direct throughput and the Rust gateway 95.3%. Every gap between them in the sweep is under 1%, whose significance cannot be established from single runs.
That leaves the per-dollar ratio resting mostly on the resource side of the model, CPU and memory, rather than on any difference in how many requests each gateway can push.
Logging cost is inside the inputs
The most important condition on all three inputs is configuration. LiteLLM’s blog says every gateway ran “with no logging callbacks, spend tracking, or persistence enabled”, and that “it is not a full-feature comparison.” The Bifrost configuration in ai-gateway-bench sets a simulated upstream, config_store: enabled: false and no plugins, but never sets logs_store or enable_logging.
In that case enable_logging defaults to true, Bifrost creates a default SQLite log store, the built-in logging plugin loads, and request and response bodies are logged because disable_content_logging defaults to false. Other built-in plugins, such as telemetry and governance, load independently. If the version-qualified inference holds, the published Bifrost results include log buffering and SQLite writes.
This finding carries a hedge that has to travel with it: it is inferred from v2.4.0 code and not yet confirmed on v1.6.4, the Bifrost version LiteLLM tested. The LiteLLM Rust config was not checked in the same way. With that caveat in place, the consequence for cost is plain. If Bifrost was logging and the Rust gateway was not, then the CPU and memory that feed the cost model describe different amounts of work, and Bifrost’s logging cost is in the inputs.
A 4 vCPU / 16 GB instance nobody benchmarked on
The 4 vCPU / 16 GB machine in LiteLLM’s cost estimate is a modelling assumption, not the hardware the benchmark ran on. No machine type, core count or worker count is stated for any of the benchmark runs, so the readings and the machine they are priced on cannot be matched.
The blog’s description of the estimate names the instance: “on a 4 vCPU / 16 GB instance”. A reader would reasonably assume this is the benchmark host. It is a modelling assumption, not the benchmark machine. No hardware, worker or core counts are stated for the benchmark runs of any gateway; only the cost model assumes a 4 vCPU / 16 GB instance.
Why the machine matters to a cost figure
A CPU percentage is a share of something. 2.59% of one machine and 2.59% of another are different amounts of work if the machines have different numbers of cores or different processors. When the readings come from an unstated host and the price comes from a stated but assumed instance, the model has to make a conversion between the two, and the files reviewed do not show what it is.
Worker counts matter for the same reason. A gateway that runs several worker processes or threads will spread load differently from one that runs a single process, and a fair comparison depends on both being configured for the hardware they run on. Without worker and core counts, the benchmark cannot be reproduced from the text alone.
The homepage’s hardware claim
The homepage describes the setup as “Identical hardware” and invites readers to “Run it yourself”, with a “See the benchmark” link. This cannot be checked from the page: no machine type, core count or worker count is given for either gateway, and the link goes to the in-page anchor #benchmark, not to the raw data or a methodology document. A reader who wants to know which machine produced the readings behind the 4.5x has no route to the answer from the page that makes the claim.
Identical hardware for both gateways is a necessary condition for a fair benchmark. It is not sufficient for a cost claim, which also needs to say what that hardware was, so that its price can be checked against the modelled instance.
Token cost sits outside the estimate
LiteLLM’s estimate covers only the gateway’s own hosting footprint and, in the blog’s words, “Excludes token cost.” The proxy’s compute and memory are one line of LLM infrastructure cost and token spend is another, so a per-dollar ratio for the gateway describes one slice of what a team will pay.
LiteLLM is explicit on this, and deserves credit for it: the blog labels the figure an estimate and says it excludes token cost. The homepage tile does not carry that qualifier. A reader who sees “~4.5x more requests per dollar” in isolation could take it to mean that routing traffic through the Rust gateway makes each request 4.5x cheaper overall. It does not. It describes the modelled cost of hosting the gateway process, before a single token is billed by a model provider.
Where the gateway sits in the bill
An LLM gateway’s job is to sit between applications and model providers, handling routing, keys, failover, budgets and logging; GenAI Brief’s explainer on what an AI gateway is covers the architecture. Its own hosting cost is compute and memory for a proxy process. The requests it forwards are billed separately by the providers, per token, and they make up a different line in the budget. GenAI Brief’s breakdown of the real cost of an AI product walks through those lines and why tokens are rarely the only one that matters.
That framing does not make the gateway’s footprint irrelevant. Teams that run a gateway in every pod, or at very high request volumes, pay its footprint many times over, and a smaller process is a genuine saving there. It does mean that “requests per dollar” for a gateway is a hosting metric, and that the dollars it refers to are not the dollars most LLM budgets are spent on.
What a gateway does to the token bill
A gateway can also change the token bill, in either direction, through features the benchmark switched off: caching, routing to cheaper models, budget enforcement. LiteLLM’s benchmark, by its own description, ran with no spend tracking or persistence, and so it says nothing about those effects for either gateway. That is a reasonable scope for a forwarding-overhead benchmark. It is a reason not to read its cost ratio as a statement about total spend.
What a real AI gateway cost comparison would need
A cost comparison a team can plan around needs the inputs published, the readings taken on the machine being priced, the same features on both sides, repeated runs with error bars, current versions, and the token bill reported alongside the hosting figure. Each answers a gap in LiteLLM’s published material or in its own caveats.
None of the items below is exotic. Each one corresponds to a specific gap in the published files. Together they describe the difference between a modelled ratio and a figure a platform team could put in a budget.
| Requirement | What LiteLLM’s material shows | What would close the gap |
|---|---|---|
| Published model inputs | The homepage does not show the inputs | Publish the CPU, memory and throughput readings used, and the rule that turns them into dollars |
| Priced on the benchmark machine | 4 vCPU / 16 GB is a modelling assumption, not the benchmark machine | State the host’s machine type and cores, and price that machine |
| Hardware and worker disclosure | No machine type, core count or worker count for any gateway | Publish hardware, worker counts, simulated-upstream latency and concurrency for every run |
| Matched configuration | Bifrost logging inferred on (from v2.4.0 code, not confirmed on v1.6.4); LiteLLM reports logging off | Run both with logging off, and again with logging on |
| Repeated trials | Single runs, no error bars; rankings flip between files | Repeat each scenario and publish error bars |
| Load-matched resource readings | CPU from a 30 s window, about 2.3 s active, possibly a different load from the throughput figure (inferred) | Sample CPU and memory over the same sustained load the throughput figure comes from |
| Current versions | Bifrost v1.6.4 against a Rust beta without streaming | Test the builds a team would deploy today |
| Memory attribution | RSS cannot identify which components account for the footprint | Heap profiles on the builds being compared |
| Total cost context | The blog says the estimate “Excludes token cost” | Report hosting cost next to token spend, not instead of it |
Gaps in LiteLLM’s homepage, blog and repo files as of November 1, 2026, with the remedy each one implies.
Published inputs and a published rule
The first requirement is the simplest. A reader should be able to take the readings, apply the rule and get the same dollar figure. That means showing the CPU and memory readings used, the throughput, the instance price assumed and how CPU share and memory were converted into a fraction of that instance. Without the rule, a reader cannot tell whether a 4x CPU difference and a 9x memory difference became a 4.4x hourly cost because of the readings or because of the conversion.
The real machine, or a clearly labelled assumption
If the readings come from one machine and the price from another, the model should say so on every surface that carries the figure, and explain the conversion. Better still, price the machine the benchmark actually ran on. Publishing hardware, worker counts, simulated-upstream latency and concurrency for every run would let a reader match readings to hardware.
The same work on both sides
A cost comparison between a gateway that is logging every request to SQLite and one that is not is a comparison of two workloads. The fair test runs both with logging off, which isolates forwarding cost, and both with logging on, which is what many production deployments look like. There is a subtlety for anyone planning their own test: on Bifrost, disabling logging alone does not remove other plugins’ hooks, so configuration parity has to be checked plugin by plugin.
Variance, not just a point estimate
Two files in the same repo disagree on total p99 at concurrency 64 by enough to reverse the order of the gateways. A cost model built on one run inherits that instability. Repeated trials with error bars show whether a 2.5% throughput gap, or a CPU difference in a short window, is a property of the gateway or of the run.
The whole bill
Finally, a cost comparison should say what fraction of total spend it covers. A gateway footprint estimate that excludes token cost is a valid number. Presented alone, as a per-dollar multiplier, it invites a reader to apply it to the wrong budget line.
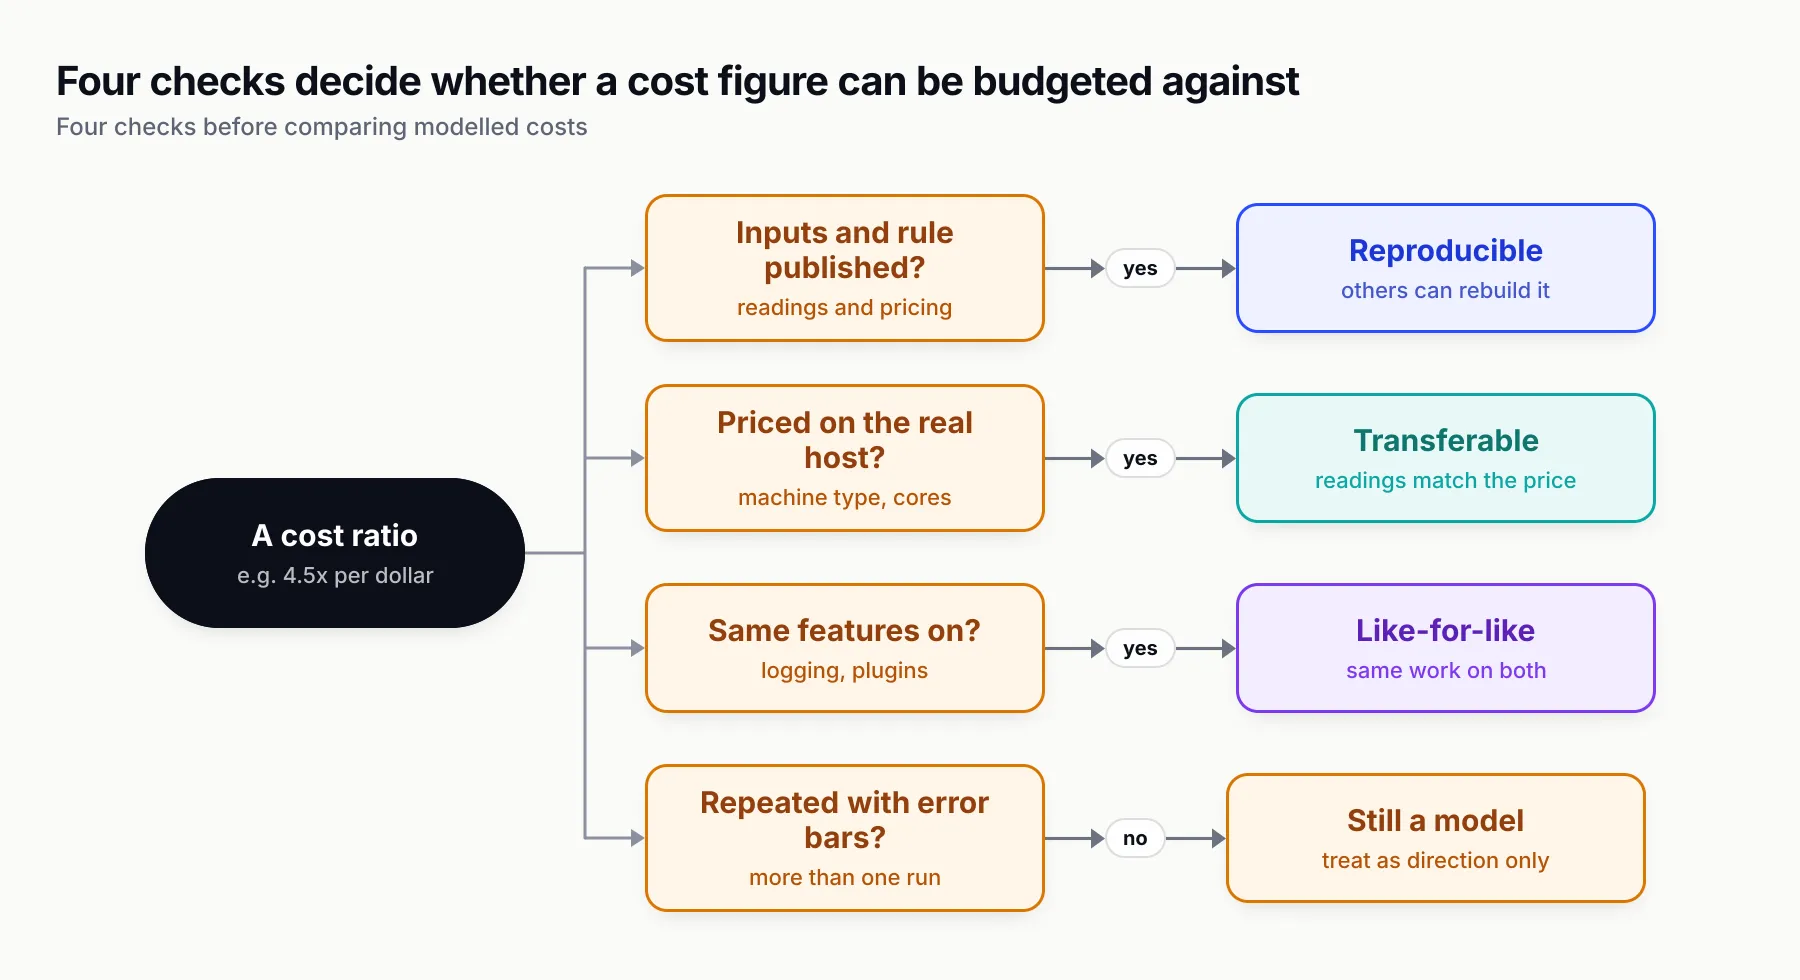
Figure 3: Four questions separate a modelled ratio from a cost figure a team can budget against. On LiteLLM’s published material as of November 1, 2026, its 4.5x does not yet meet any of them.
How the cost picture changes for different teams
How much a gateway’s hosting footprint matters depends on how it is deployed. Teams running one gateway per pod pay the footprint many times; teams running a few shared replicas pay it a few times; and teams that need request logs need a comparison with logging on, which LiteLLM’s figures do not provide.
The scenarios below use only the figures in LiteLLM’s files. They do not put a dollar amount on any deployment, because the published material does not support one.
A team running the gateway as a sidecar in every pod
Here the resting footprint, multiplied by the number of pods, is the cost that matters. The Rust gateway’s smaller memory and lower CPU in the files are directly relevant, and we think this is the scenario where the direction of LiteLLM’s result is most likely to show up as a real saving. The caution is about magnitude: the memory multiple ranges from 5.4x to 9.1x depending on the file, the Bifrost build is v1.6.4 with logging probably on, and Bifrost’s developers describe lower memory use in the 2.x release line, though no figure for the reduction has been published. A team in this position should measure the builds it would deploy, idle, in its own pods.
A team running a few shared gateway replicas
Here the gateway’s footprint is paid a handful of times, and throughput under sustained load sets how many replicas are needed. In the main sweep, the two gateways are within 1% of each other on throughput at every concurrency level tested, and at concurrency 64 Bifrost keeps 95.2% of direct throughput and the Rust gateway 95.3%. For this team, the ceiling-based estimate must be read with that run’s resource measurements and the chosen unit prices. The separate short CPU time series cannot be assumed to supply its inputs. Hosting cost also needs to be considered beside token spend, which the estimate excludes.
A team that needs request logs and spend tracking
For this team, the benchmark’s configuration is not the one it will run. LiteLLM’s blog says its gateways ran with no logging callbacks, spend tracking or persistence, and that “it is not a full-feature comparison.” A team that needs request logs needs a comparison with logging on for both gateways. The cited benchmark does not establish the cost of that matched-feature configuration.
A team currently on the Python proxy
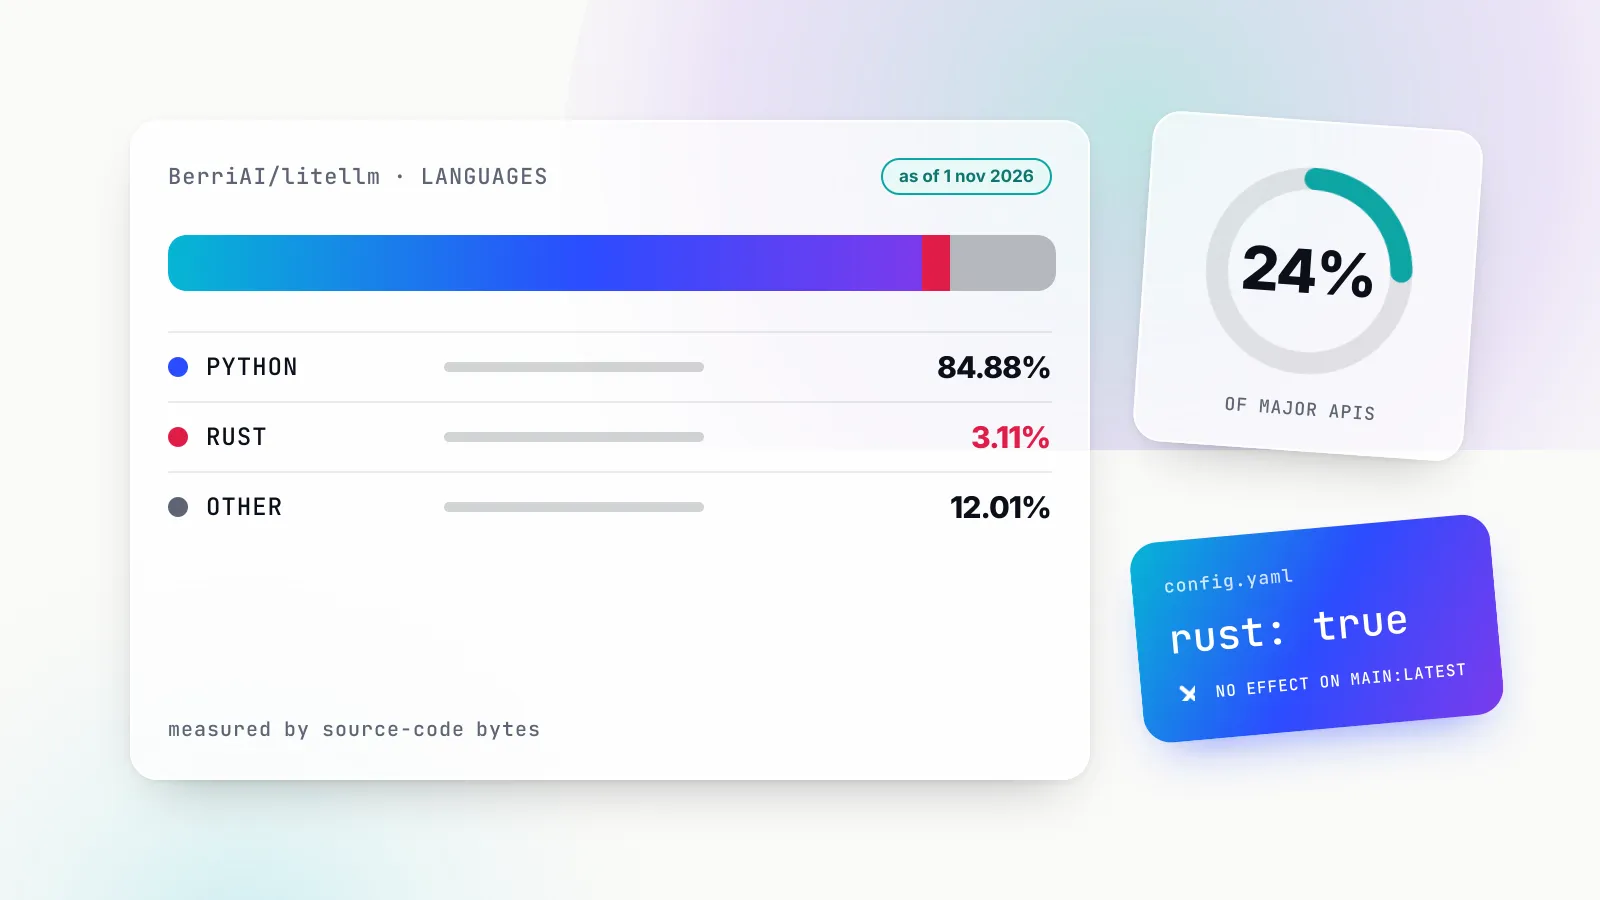
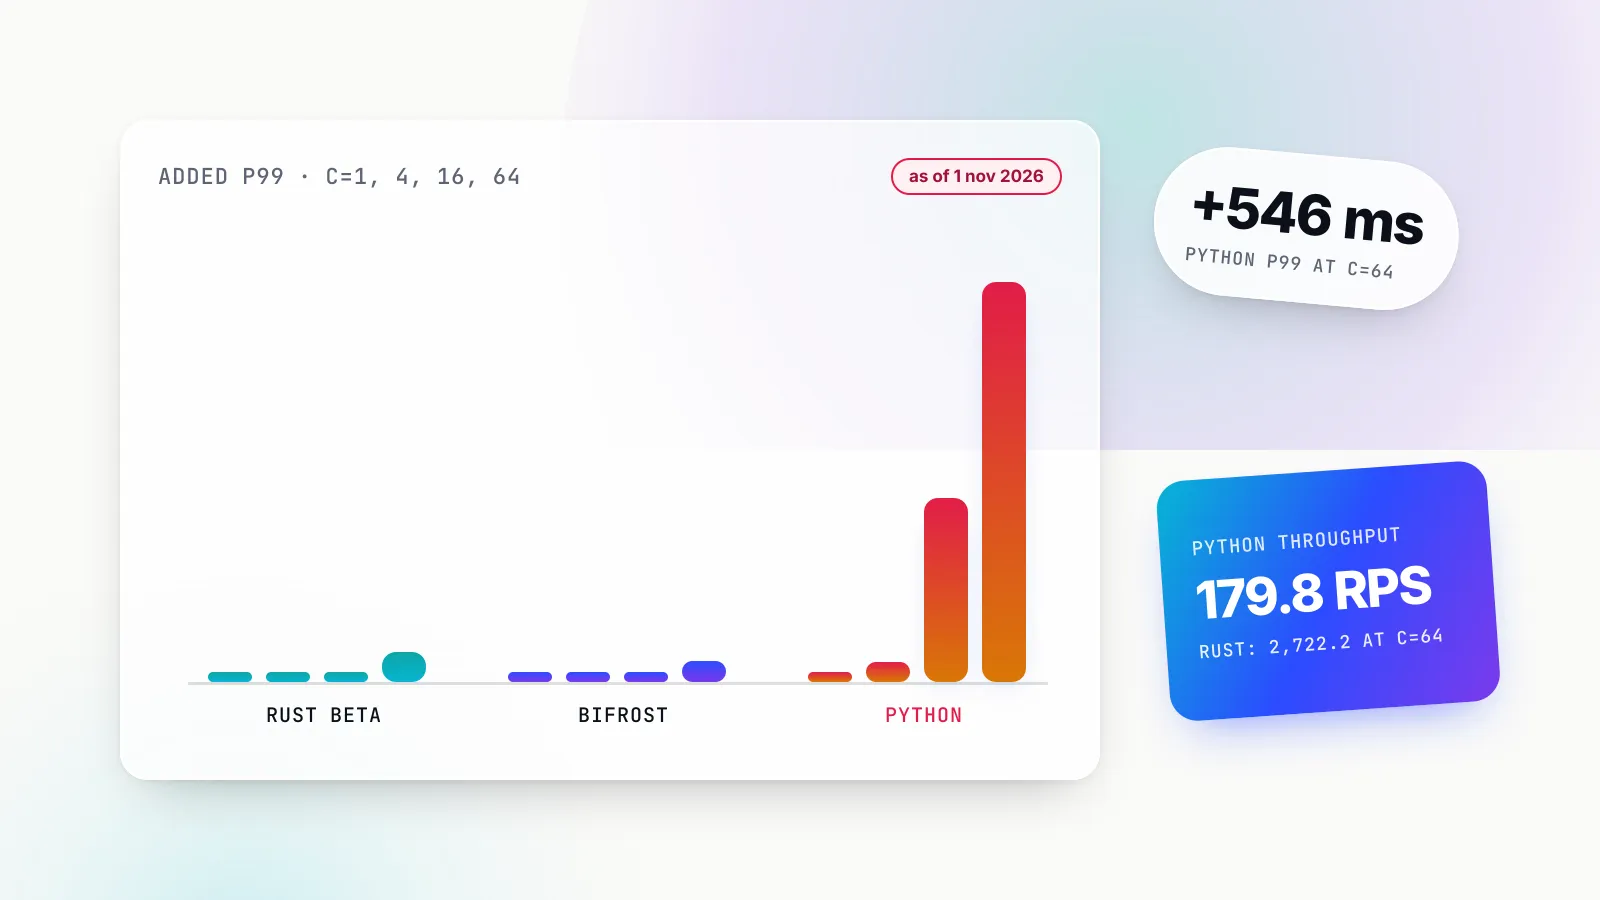
LiteLLM’s own sweep shows its Python proxy adding 546.04 ms of p99 at concurrency 64 and delivering 179.8 requests per second, against 2,722.2 for the Rust gateway. A team on the Python proxy has a real performance reason to look at alternatives. It should not assume the Rust gateway’s benchmarked numbers apply to its current deployment: as GenAI Brief reported in whether LiteLLM is written in Rust, Chat Completions and Messages still run on Python in main:latest, and the per-model rust: true flag currently has no effect.
Gateway settings that move the cost inputs
The resource readings behind any gateway cost model depend on which features are switched on. For Bifrost, the documented settings that most affect the benchmark’s inputs are its logging controls, and its governance features address the token side of the bill that the estimate leaves out.
For teams already running Bifrost, the open-source gateway whose v1.6.4 build LiteLLM tested, the configuration findings above translate into settings worth checking before running any cost test of their own.
Logging controls
Bifrost’s client configuration documentation lists enable_logging (“Log all LLM requests and responses”) and disable_content_logging, which defaults to false and strips message content from the log store while keeping metadata. On v1.6.4, enable_logging: false removes the built-in logging plugin’s queue and hooks at startup, while disable_content_logging: true reduces logged payloads. Smaller writer batches and queues lower queue-plus-batch capacity, with a trade-off of more write overhead and dropped logs under bursts.
For a like-for-like cost test against a gateway configured with logging off, those are the settings to set explicitly rather than leave at their defaults. For a production cost estimate, they are the settings to leave as production will run them.
Budgets on the token side
Token spending sits outside this hosting-cost estimate. When evaluating total cost, record token usage and any budget controls alongside CPU and memory; a smaller gateway process does not by itself imply a proportionately smaller LLM bill.
GenAI Brief’s overview of the options is in LiteLLM alternatives in 2026.
What to take from the 4.5x figure
The 4.5x is correct division on the published RPS and estimated hourly-cost outputs. In the ceiling run Rust uses less average CPU but more peak RSS than Bifrost. The repository publishes resource measurements and pricing assumptions; the result remains a model rather than an observed production saving. The logging configuration is disputed and version-qualified, and its contribution is not measured.
The fair reading has three parts.
First, the direction is supported. In LiteLLM’s files, the Rust beta used less CPU than Bifrost v1.6.4 (0.66% against 2.59% mean, 15.9% against 79.5% peak) and lower peak RSS in three of four published file sets. The ceiling-based hourly estimate is lower for Rust despite its higher peak RSS in that run; a modeled cost result does not establish a universal resource or production-cost advantage.
Second, the magnitude is not settled. The materials report 4.5x, about 5.8x and 4.4x under different cost framings. The short CPU series is not the ceiling-run CPU measurement, and the files do not justify treating every cost summary as the same estimate. Each result needs its own inputs and conditions. The hourly figure is derived from resource measurements; it is not a result showing the same savings in production.
Third, the scope is narrow. The estimate covers the gateway’s hosting footprint and, by LiteLLM’s own statement, excludes token cost. Applied to a whole LLM budget, a gateway per-dollar multiplier answers a question nobody asked.
For anyone quoting the figure, an accurate sentence is available: “LiteLLM’s cost model estimates about 4.5x more RPS per dollar of estimated hourly cost for its Rust beta than for Bifrost v1.6.4, priced on an assumed 4 vCPU / 16 GB instance, as of November 1, 2026.” For anyone choosing a gateway on cost, the practical step is the one the files cannot provide: run the builds you would deploy, on the machine you would pay for, with the features you need switched on, and add the hosting figure to the token bill rather than treating it as the bill.
Source: Debunking LiteLLM Rust Benchmarking: Part 1, by Akshay Deo of Maxim AI, which builds the Bifrost gateway.
Sources
- Published chart code and cost assumptions
- Throughput ceiling results: memory, CPU and sustained RPS
- Debunking LiteLLM Rust Benchmarking: Part 1 Maxim AI
- LiteLLM homepage benchmark section LiteLLM
- Rust AI gateway benchmarks (LiteLLM blog) LiteLLM
- rps_per_dollar.csv (ai-gateway-bench results) BerriAI (GitHub)
- cpu_bifrost.csv (ai-gateway-bench results) BerriAI (GitHub)
- cpu_rust.csv (ai-gateway-bench results) BerriAI (GitHub)
- latency_vs_concurrency.csv (ai-gateway-bench results) BerriAI (GitHub)
- ai-gateway-bench Bifrost gateway configuration and README BerriAI (GitHub)
- Bifrost client configuration (config.json) Maxim AI
- Bifrost budget and limits Maxim AI
Frequently asked questions
Is LiteLLM Rust cheaper to run than Bifrost?
In LiteLLM's own cost model, yes: it estimates $0.0099 per hour for the Rust gateway against $0.0434 for Bifrost. That estimate is modelled on an assumed 4 vCPU / 16 GB instance, not measured on the benchmark machine, and the contribution of logging to those inputs is unquantified and depends on the version-qualified configuration inference. The Rust gateway has lower CPU readings, while peak RSS favors Rust in three sets and Bifrost in the ceiling run.
Is LiteLLM's 4.5x more requests per dollar claim accurate?
The arithmetic is accurate. LiteLLM's rps_per_dollar.csv gives 283,833 RPS per dollar of estimated hourly cost for the Rust gateway and 63,246 for Bifrost, and 283,833 divided by 63,246 is 4.5x. The figure is a model, though: the homepage does not show the inputs, and the instance it is priced on is an assumption.
Why does LiteLLM's blog say 6x when the homepage says 4.5x?
They are different metrics. The blog's 'roughly 6x' compares estimated cost per one million requests, $0.001008 for Bifrost against $0.000175 for Rust, which is about 5.8x. The homepage's 4.5x compares RPS per dollar of estimated hourly cost. A third ratio, 4.4x, compares the modelled hourly cost.
What does requests per dollar mean in an AI gateway benchmark?
In this file it is sustained requests per second divided by estimated hourly infrastructure cost. It is a rate-to-cost ratio, not a count of requests purchased for one dollar. It depends on both the throughput measured and the price assumed for the machine, so it is only as reliable as those two inputs and the conditions they were recorded under.
Does LiteLLM's gateway cost estimate include token costs?
No. LiteLLM's blog describes the figure as an estimate built from measured CPU, peak RSS and sustained throughput, and states that it excludes token cost. It describes what the gateway process might cost to host, not what a team pays model providers.
How do you compare LLM gateway infrastructure cost fairly?
Run both gateways on the machine you will deploy, with the same features switched on, and record CPU, memory and throughput over repeated runs with error bars. Publish the hardware, worker counts, versions and pricing inputs, and report the hosting figure alongside the token bill rather than instead of it.